
NCERT Solutions for Class 8 Maths Chapter 15 Exercise 15.3 Introduction to graphs in English Medium and Hindi Medium updated for the session 2020 – 2021 based on latest CBSE syllabus. Solutions in Hindi medium are given below just after the English medium solutions.
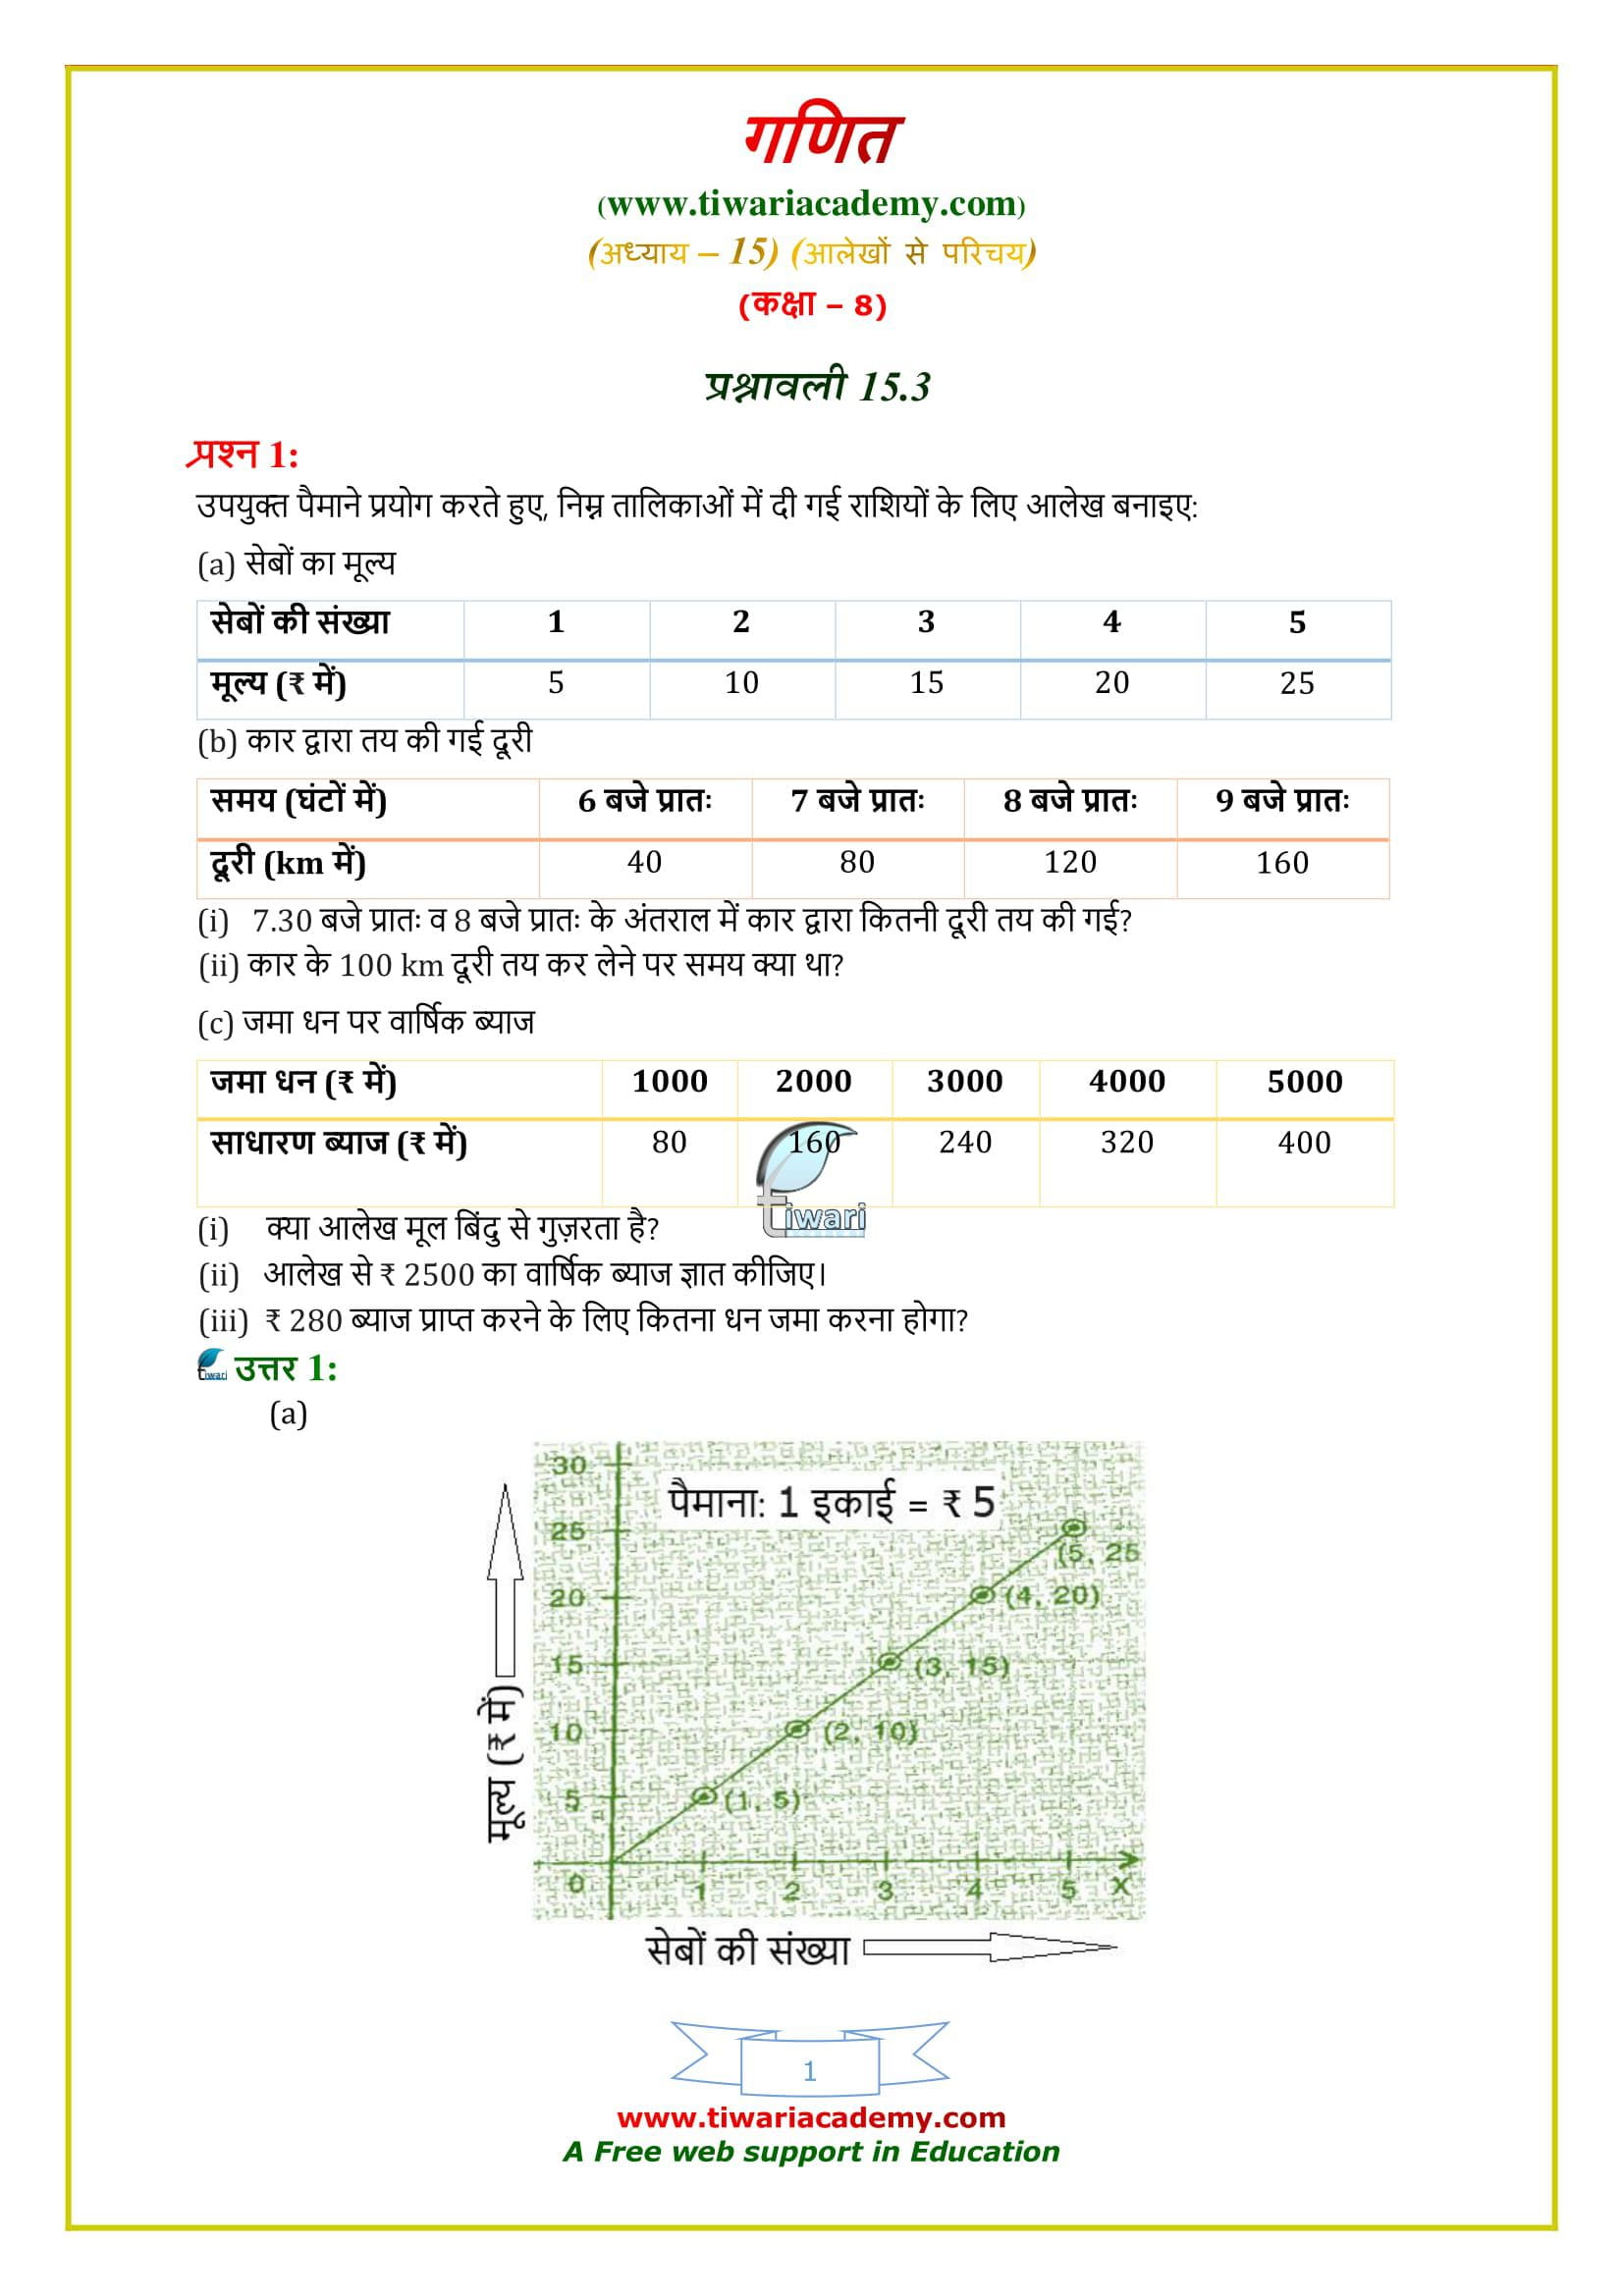
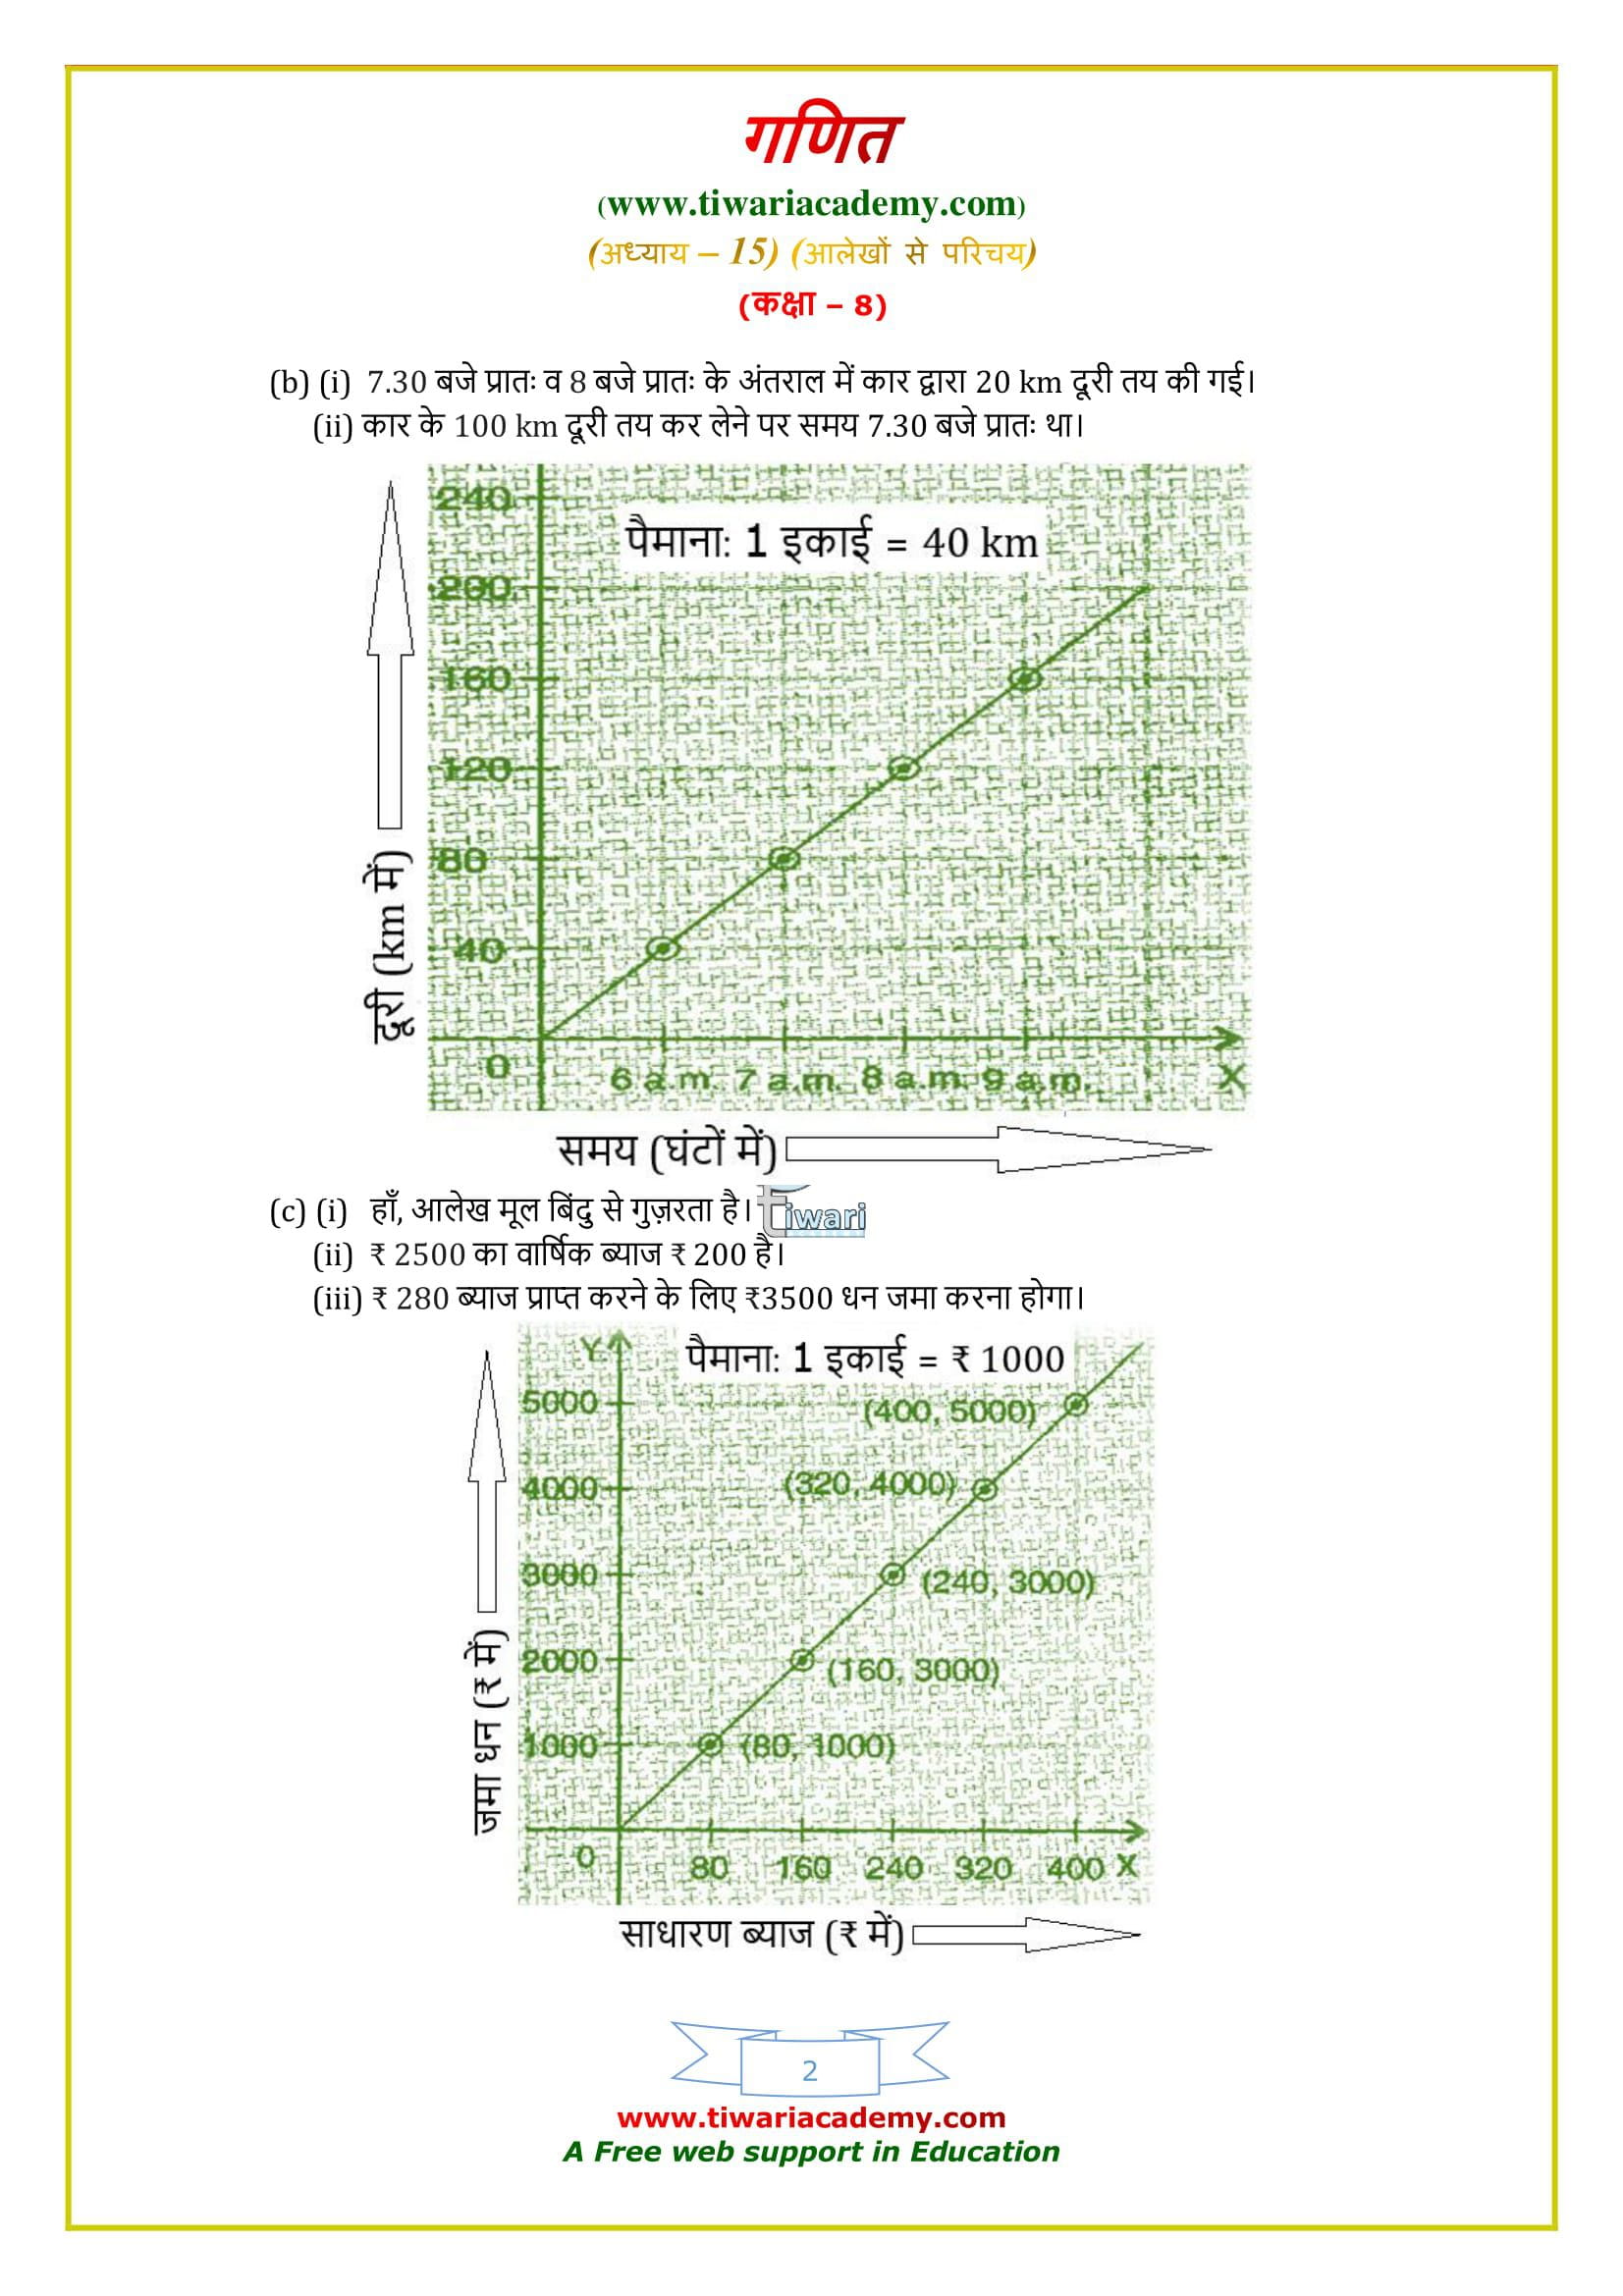
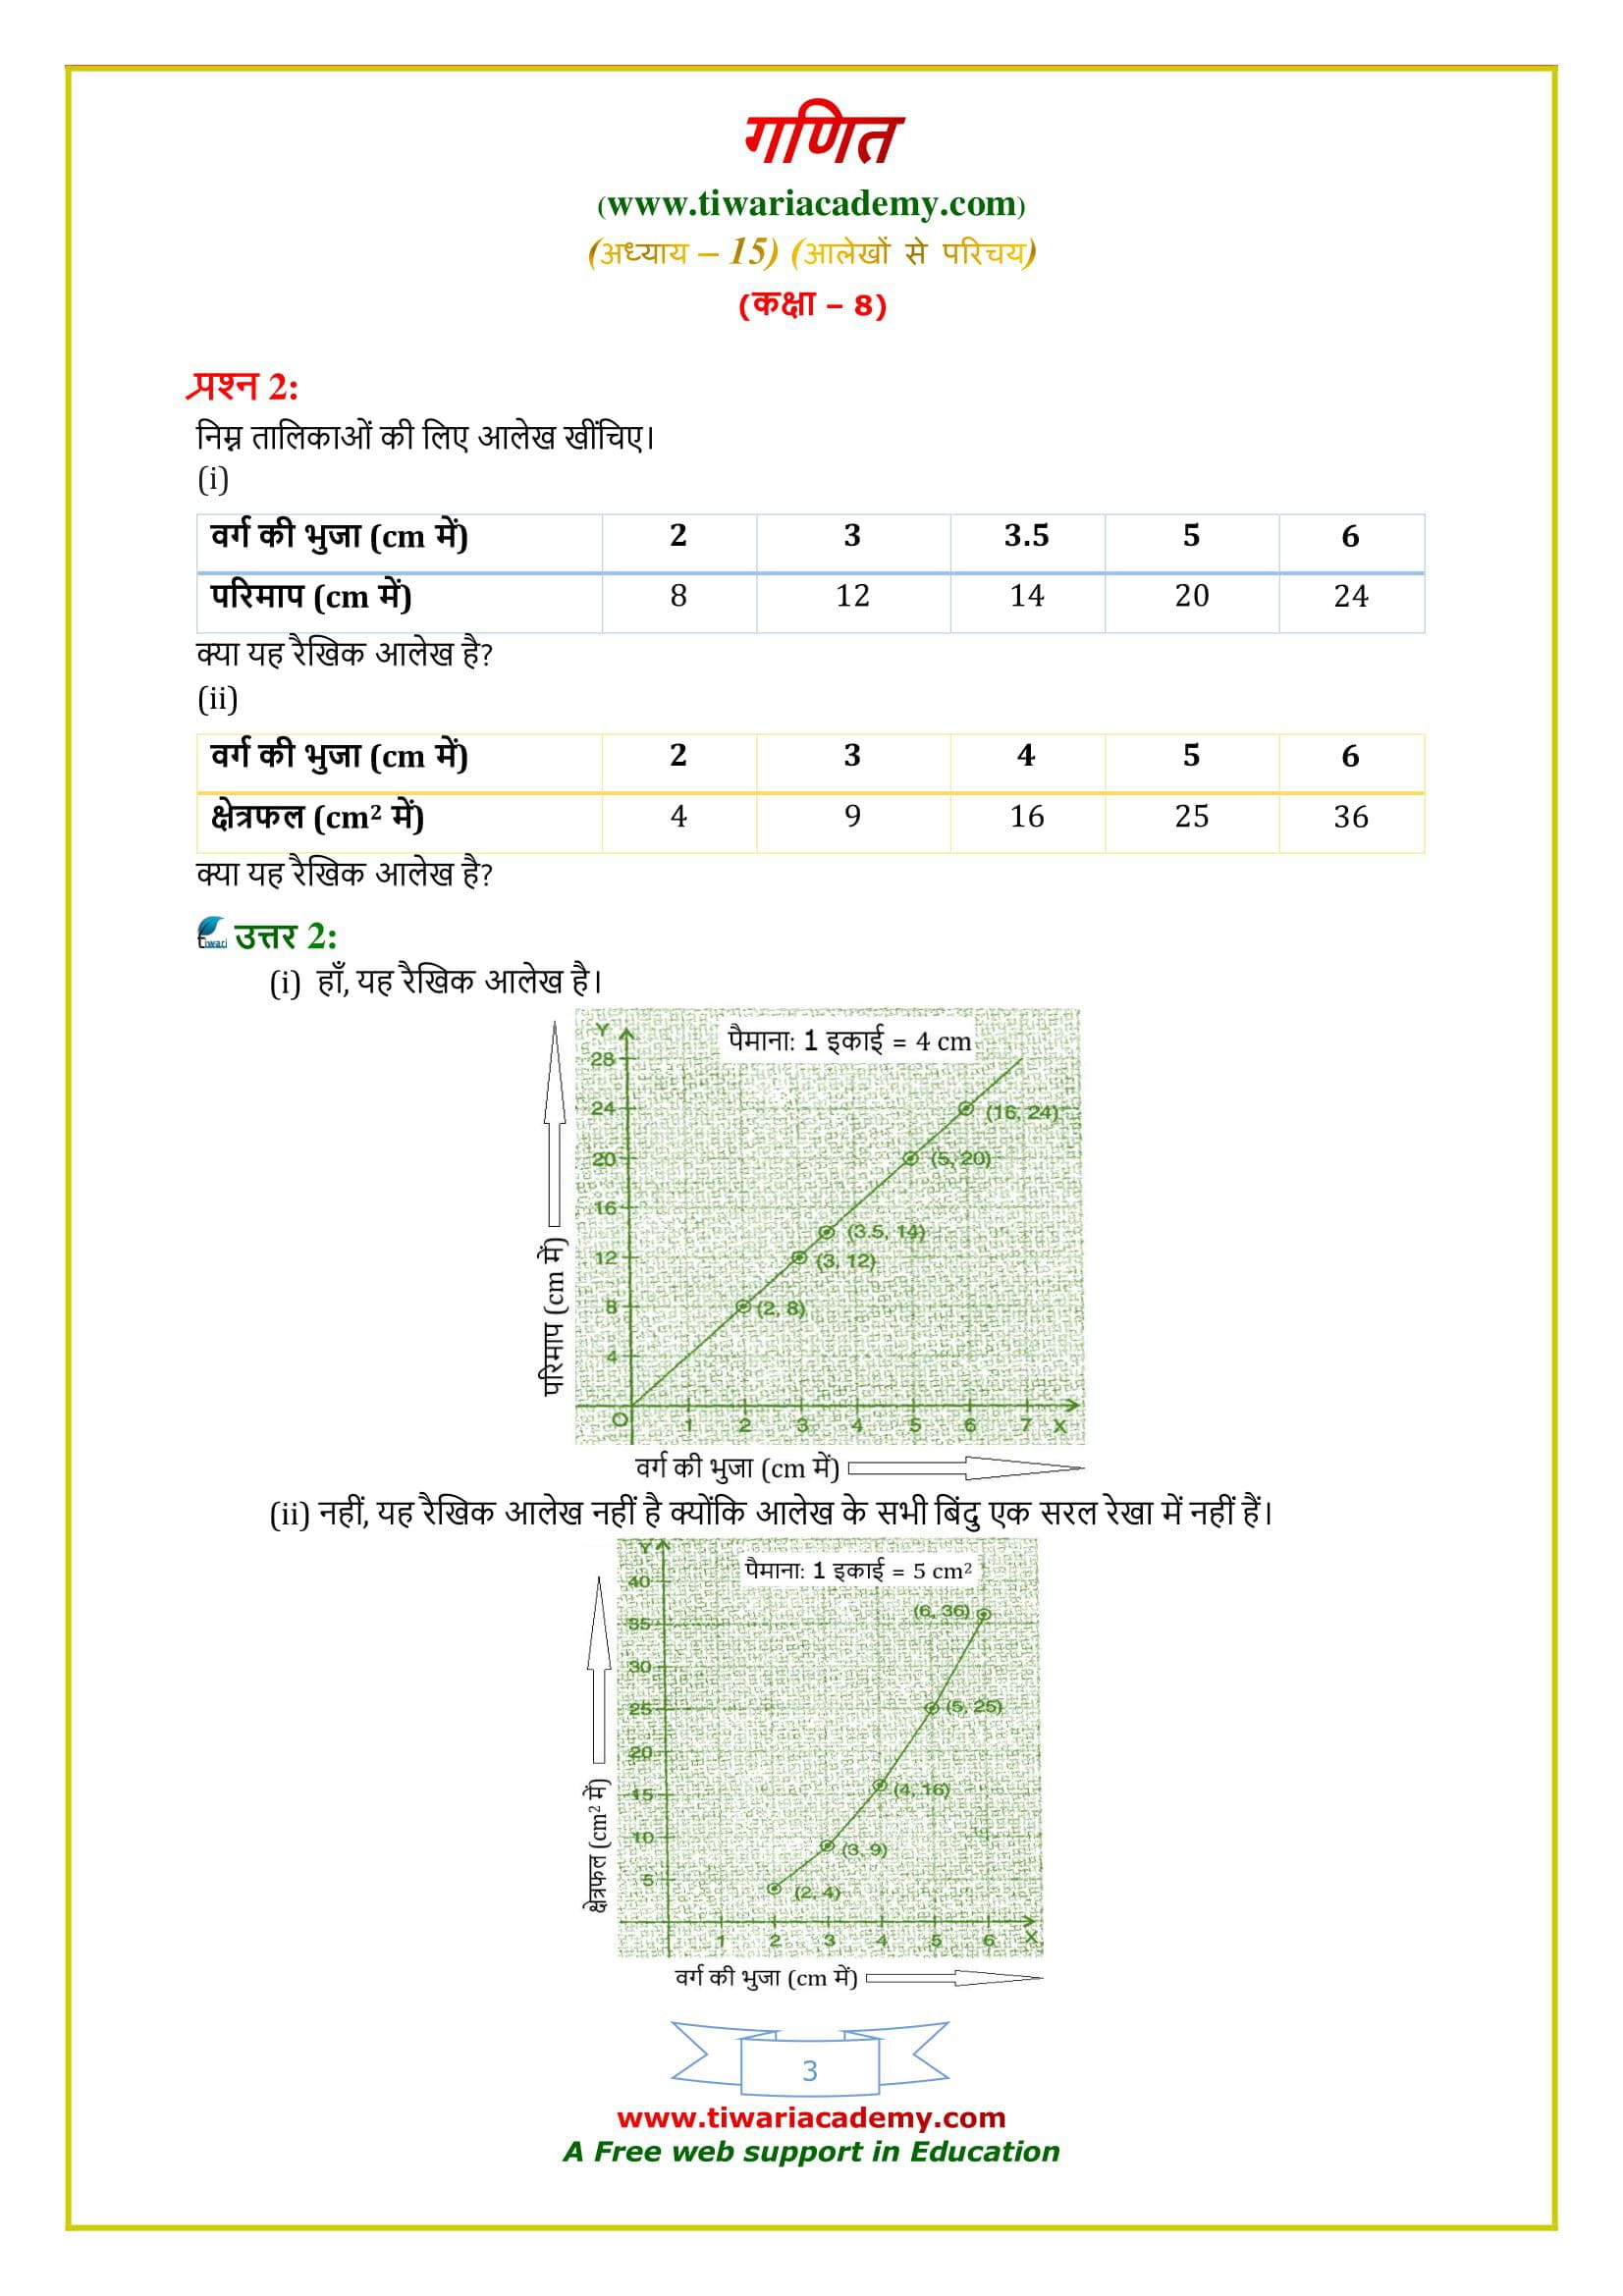
NCERT Solutions for Class 8 Maths Chapter 15 Exercise 15.3
If you need solutions in Hindi, Click for Hindi Medium solutions of 8 Maths Exercise 15.3
8 Maths Chapter 15 Exercise 15.3 in Hindi
To get the solutions in English, Click for English Medium solutions.
8 Maths Exercise 15.3 – Important Questions
Questions for Practice
1. A dice is rolled once. What is the probability that the number on top will be
(a) Odd (b) Greater than 5 (c) A multiple of 3 (d) Less than 1 (e) A factor of 36 (f) A factor of 6
2. Draw a histogram for the frequency distribution table given in Example 13 and answer the following questions. (i) Which class interval has the maximum number of workers? (ii) How many workers earn ₹850 and more? (iii) How many workers earn less than ₹ 850? (iv) How many workers earn ₹ 820 or more but less than ₹ 880?
3. Shikhar draws a ball from a bag that contains white and yellow balls. The probability of choosing a white ball is 2/9. If the total number of balls in the bag is 36, find the number of yellow balls.
The marks obtained (out of 20) by 30 students of a class in a test are as follows: 14, 16, 15, 11, 15, 14, 13, 16, 8, 10, 7, 11, 18, 15, 14, 19, 20, 7, 10, 13, 12, 14, 15, 13, 16, 17, 14, 11, 10, 20.
Prepare a frequency distribution table for the above data using class intervals of equal width in which one class interval is 4 –8 (excluding 8 and including 4).
4. Construct a frequency distribution table for the following weights (in grams) of 35 mangoes, using the equal class intervals, one of them is 40 – 45 (45 not included). 30, 40, 45, 32, 43, 50, 55, 62, 70, 70, 61, 62, 53, 52, 50, 42, 35, 37, 53, 55, 65, 70, 73, 74, 45, 46, 58, 59, 60, 62, 74, 34, 35, 70, 68.
(a) How many classes are there in the frequency distribution table?
(b) Which weight group has the highest frequency?
5. The following histogram shows the frequency distribution of teaching experiences of 30 teachers in various schools: (a) What is the class width? (b) How many teachers are having the maximum teaching experience and how many have the least teaching experience? (c) How many teachers have teaching experience of 10 to 20 years?