
Free download NCERT Solutions for Class 10 Maths Chapter 14 Exercise 14.3 statistics in English Medium and Hindi Medium PDF form. Solutions for class x all subjects in the same format are also available. The other Exercises of this chapter like Exercise 14.1 or Exercise 14.2 or Exercise 14.4 are here to view it online. At the end of solutions, some practice questions are given with answers. These are important questions and are selected form CBSE Board Papers to provide students good practice for the exams preparation. For any further suggestions, please feel free to call or mail us.
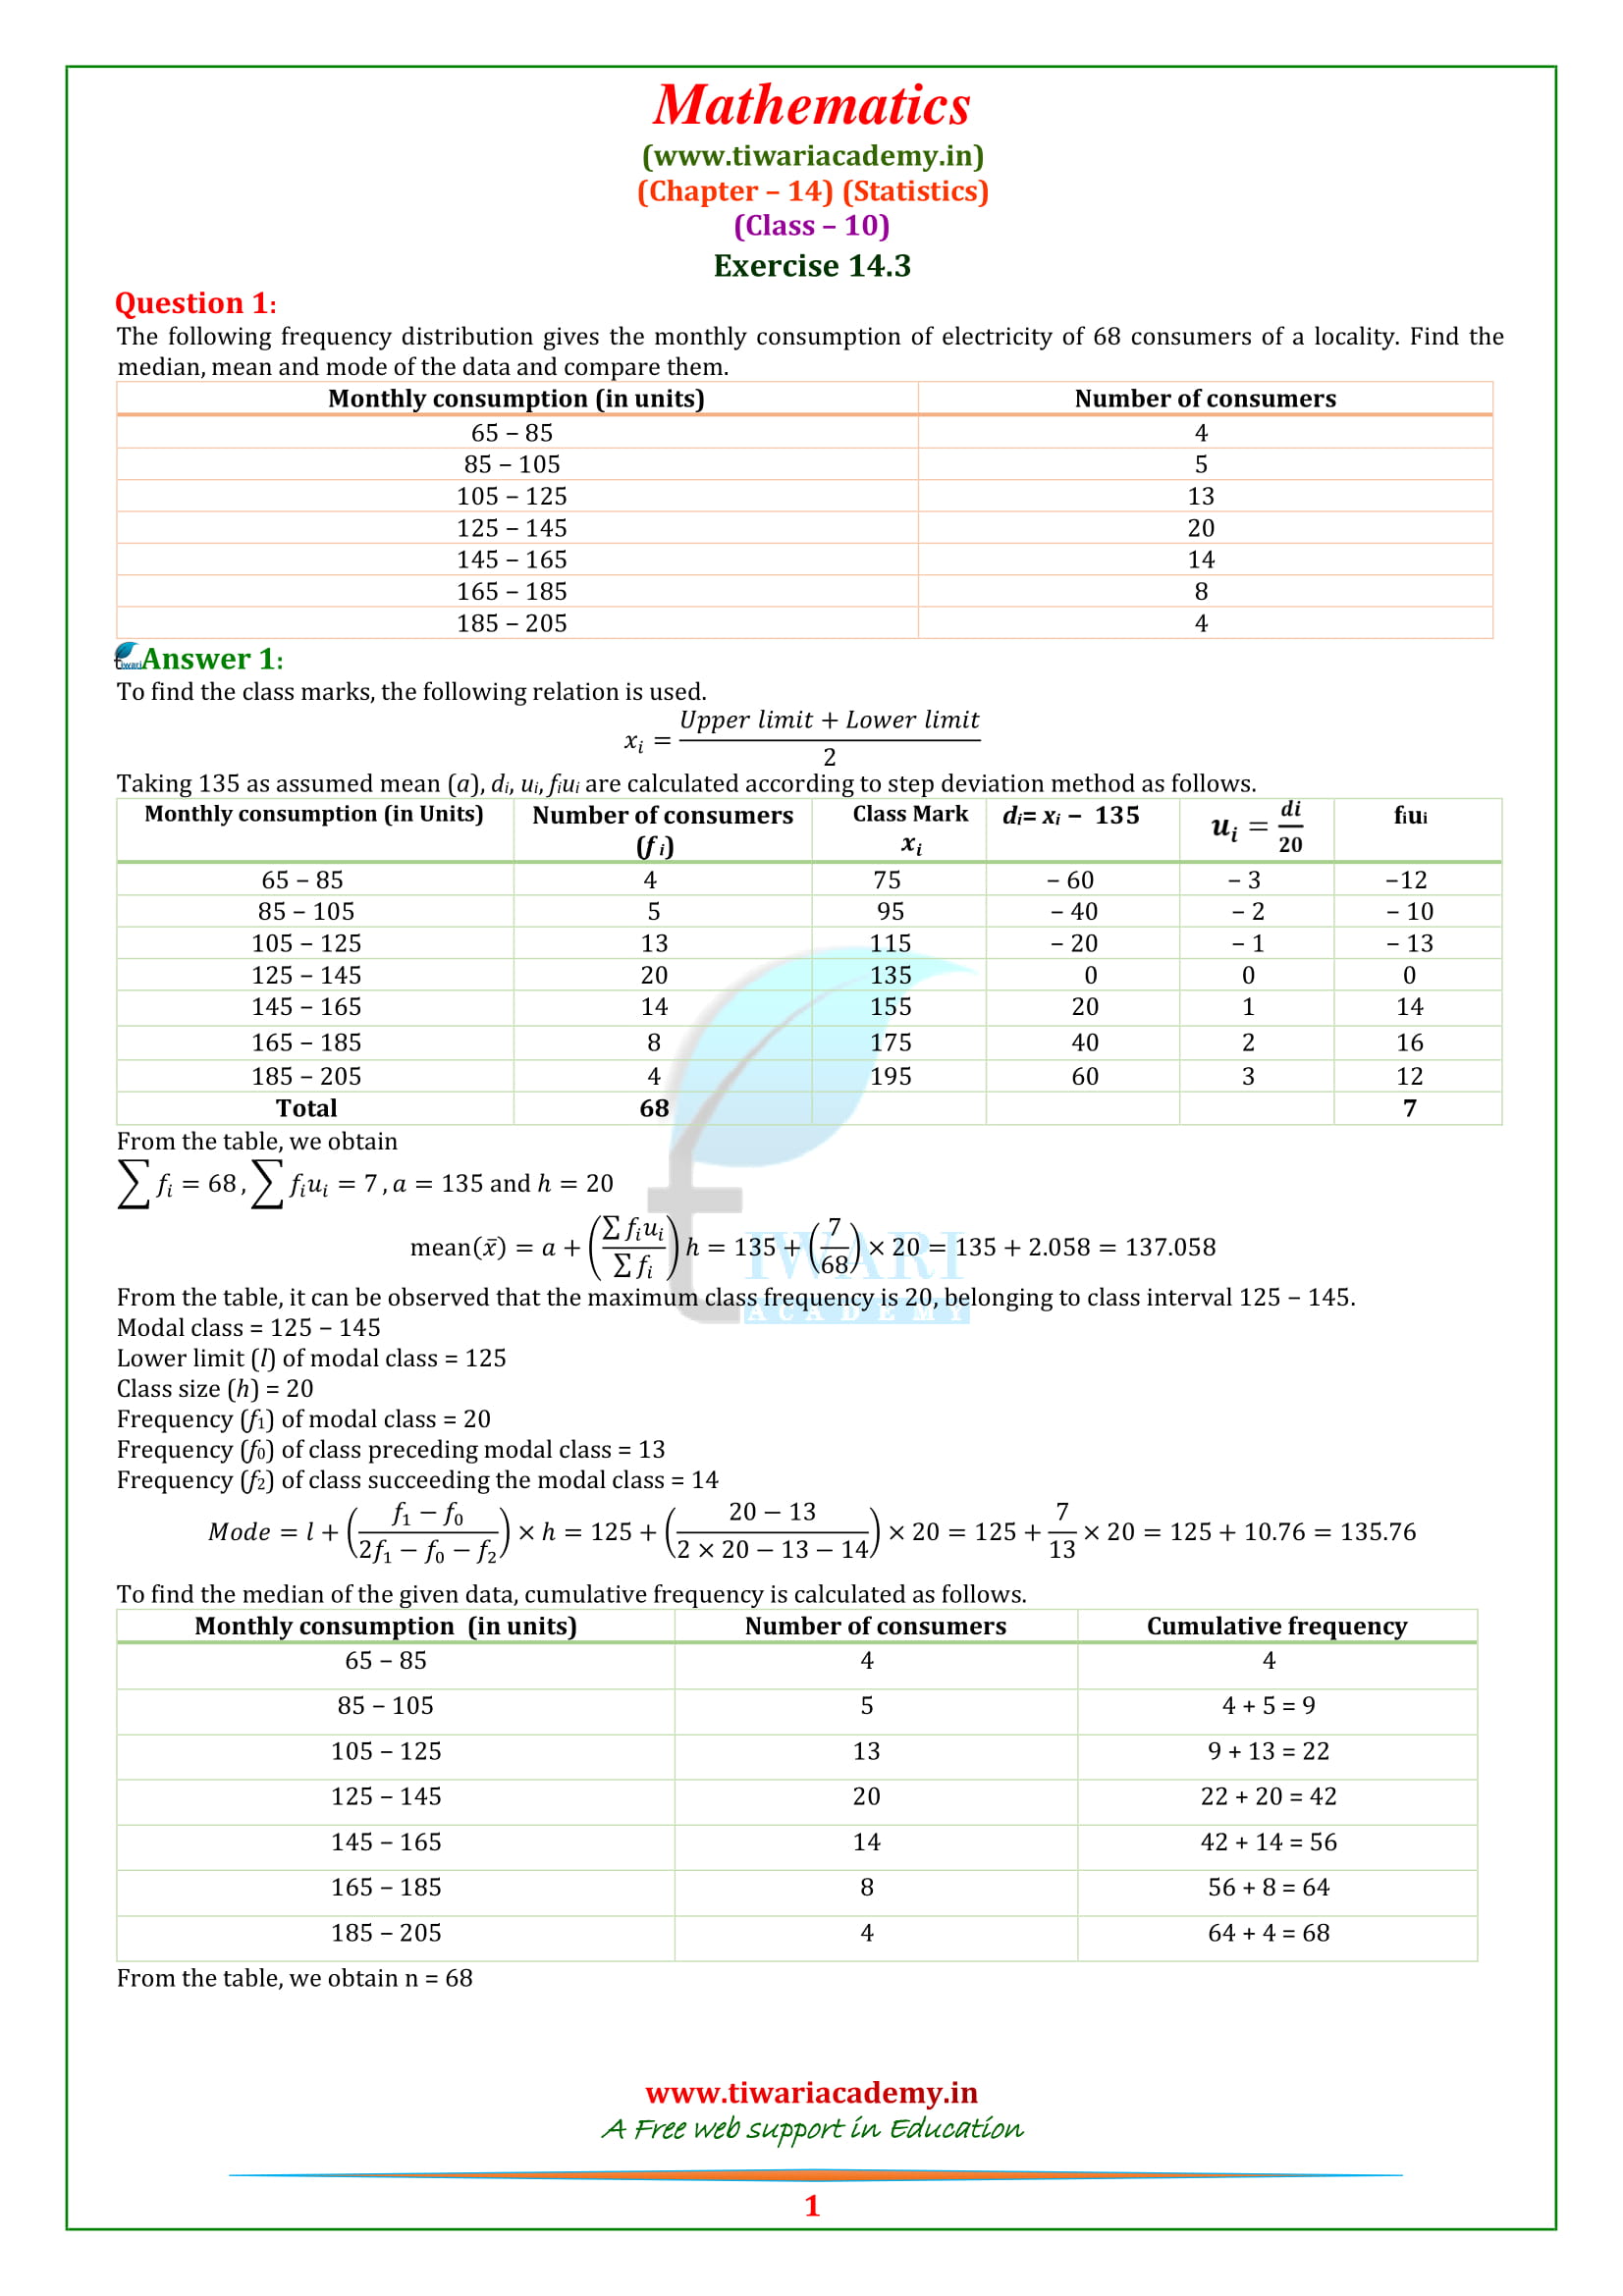
NCERT Solutions for Class 10 Maths Chapter 14 Exercise 14.3
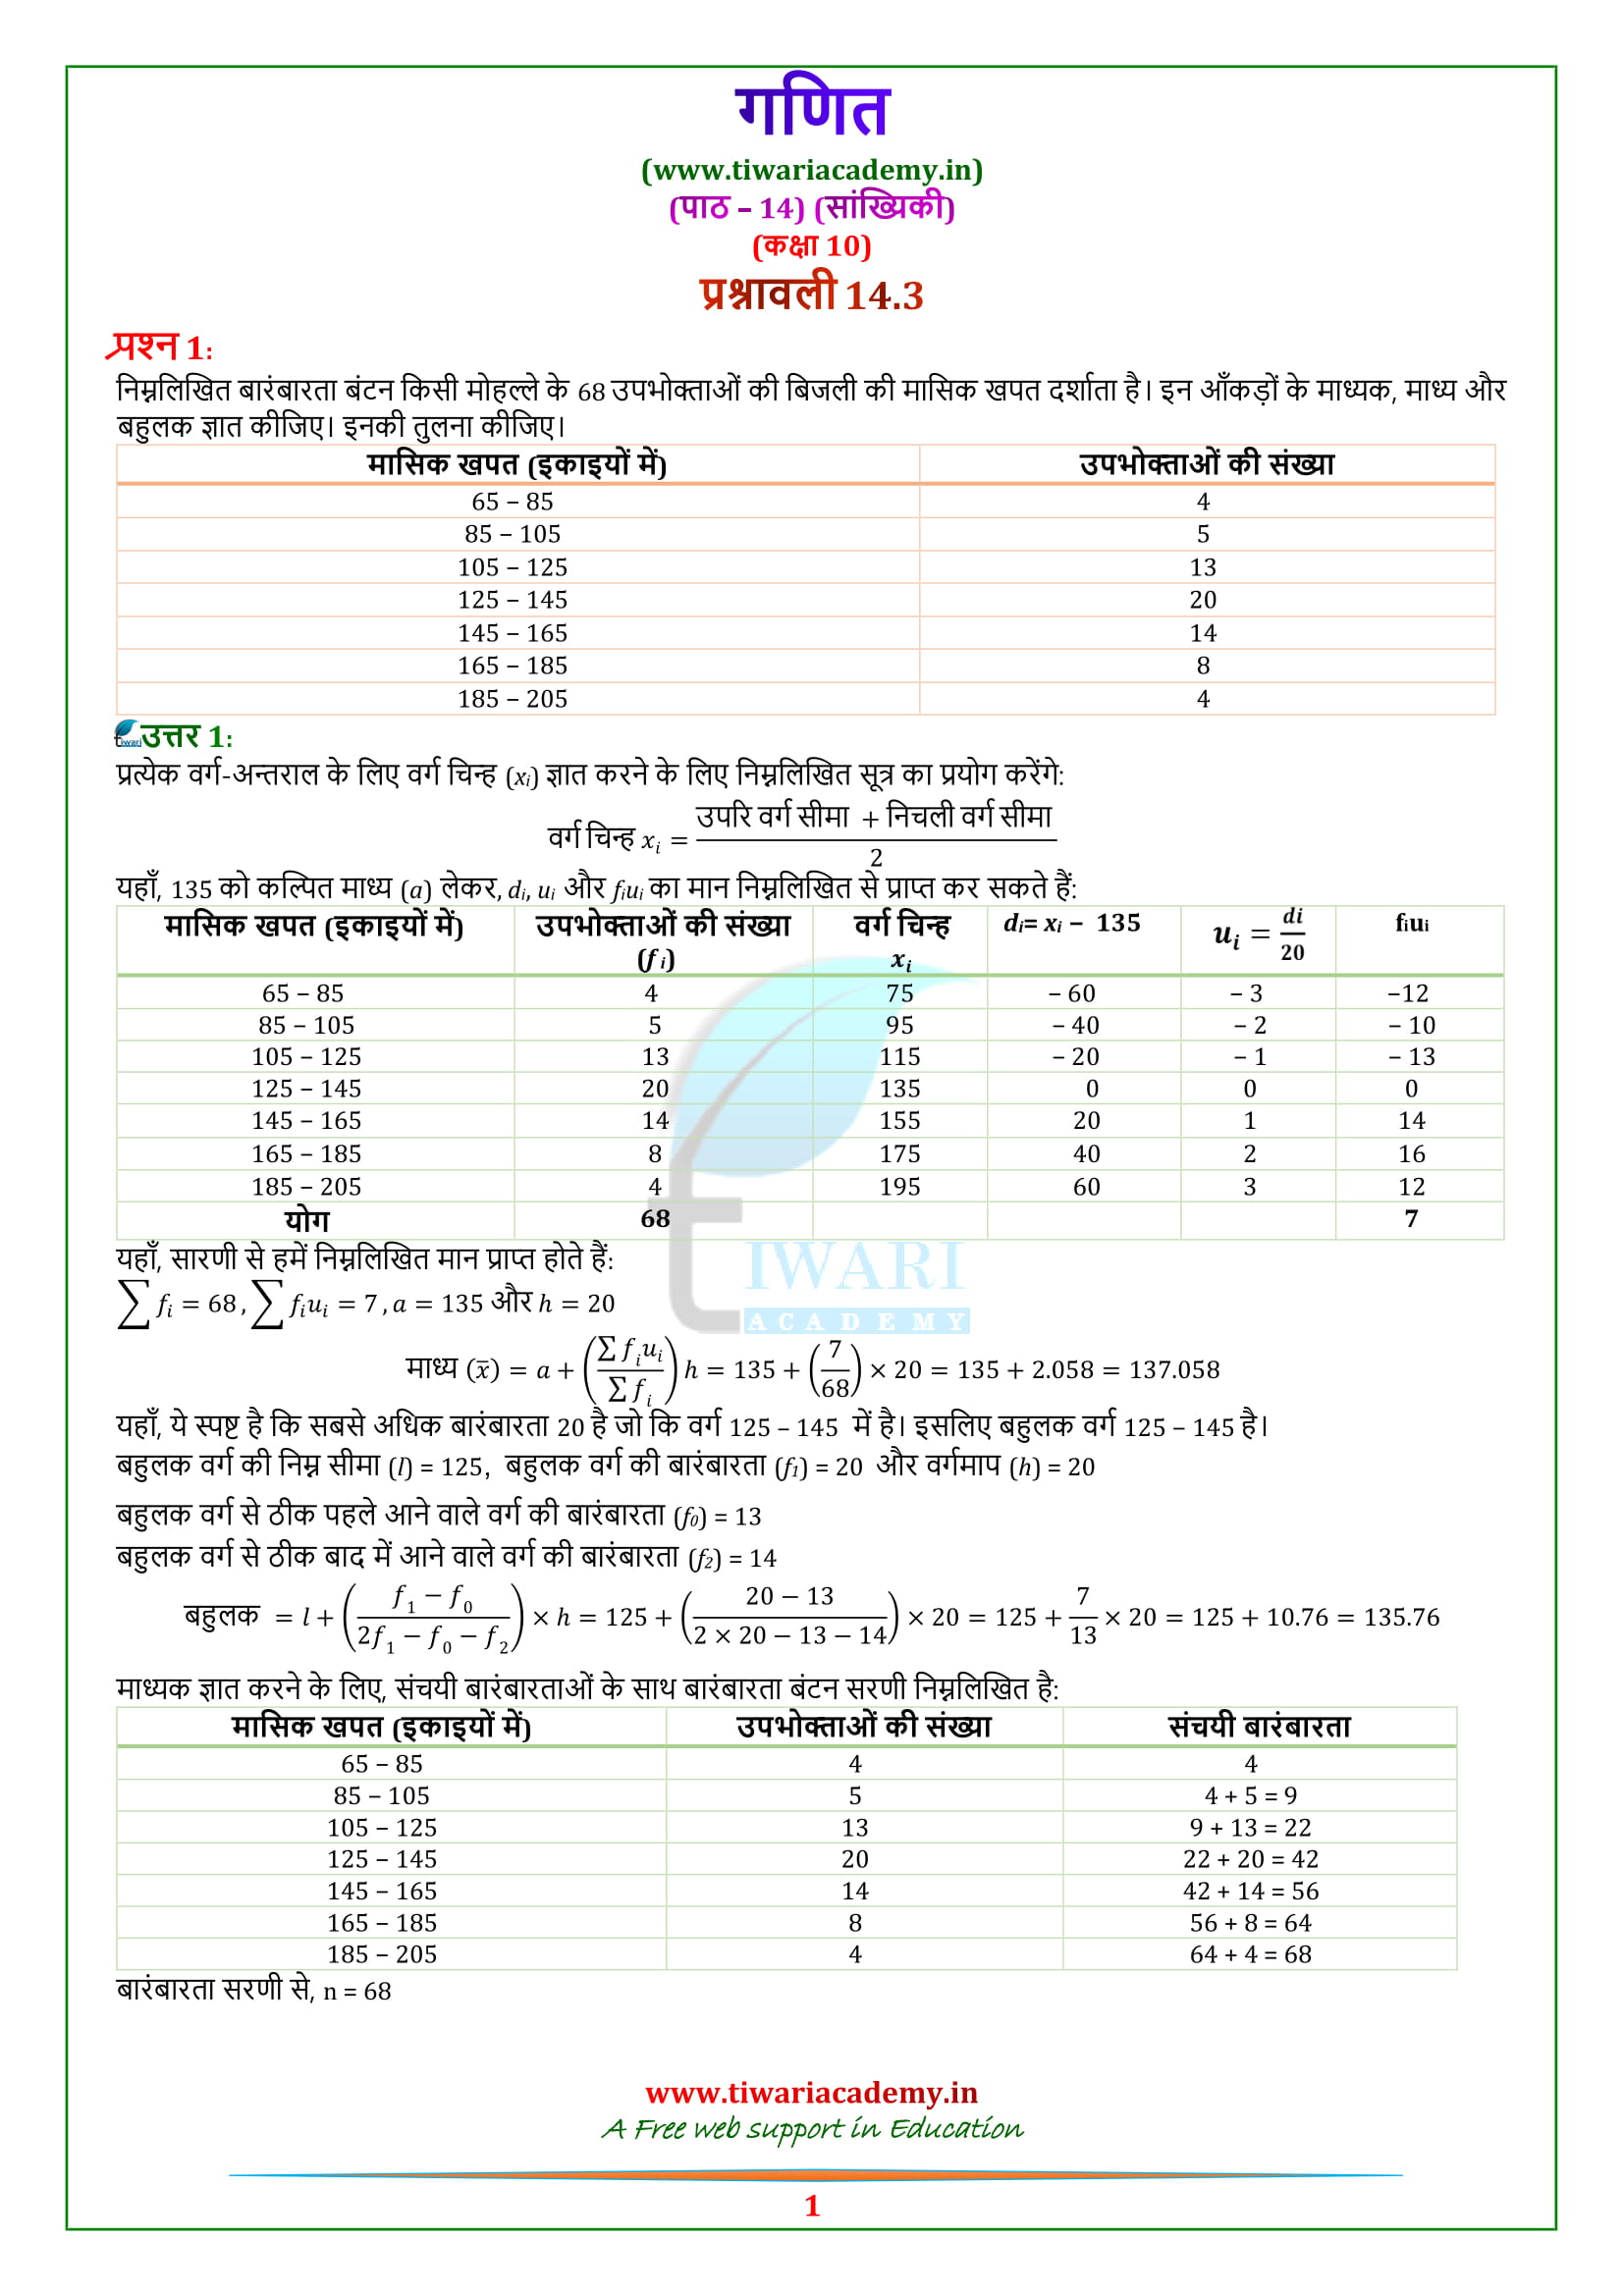
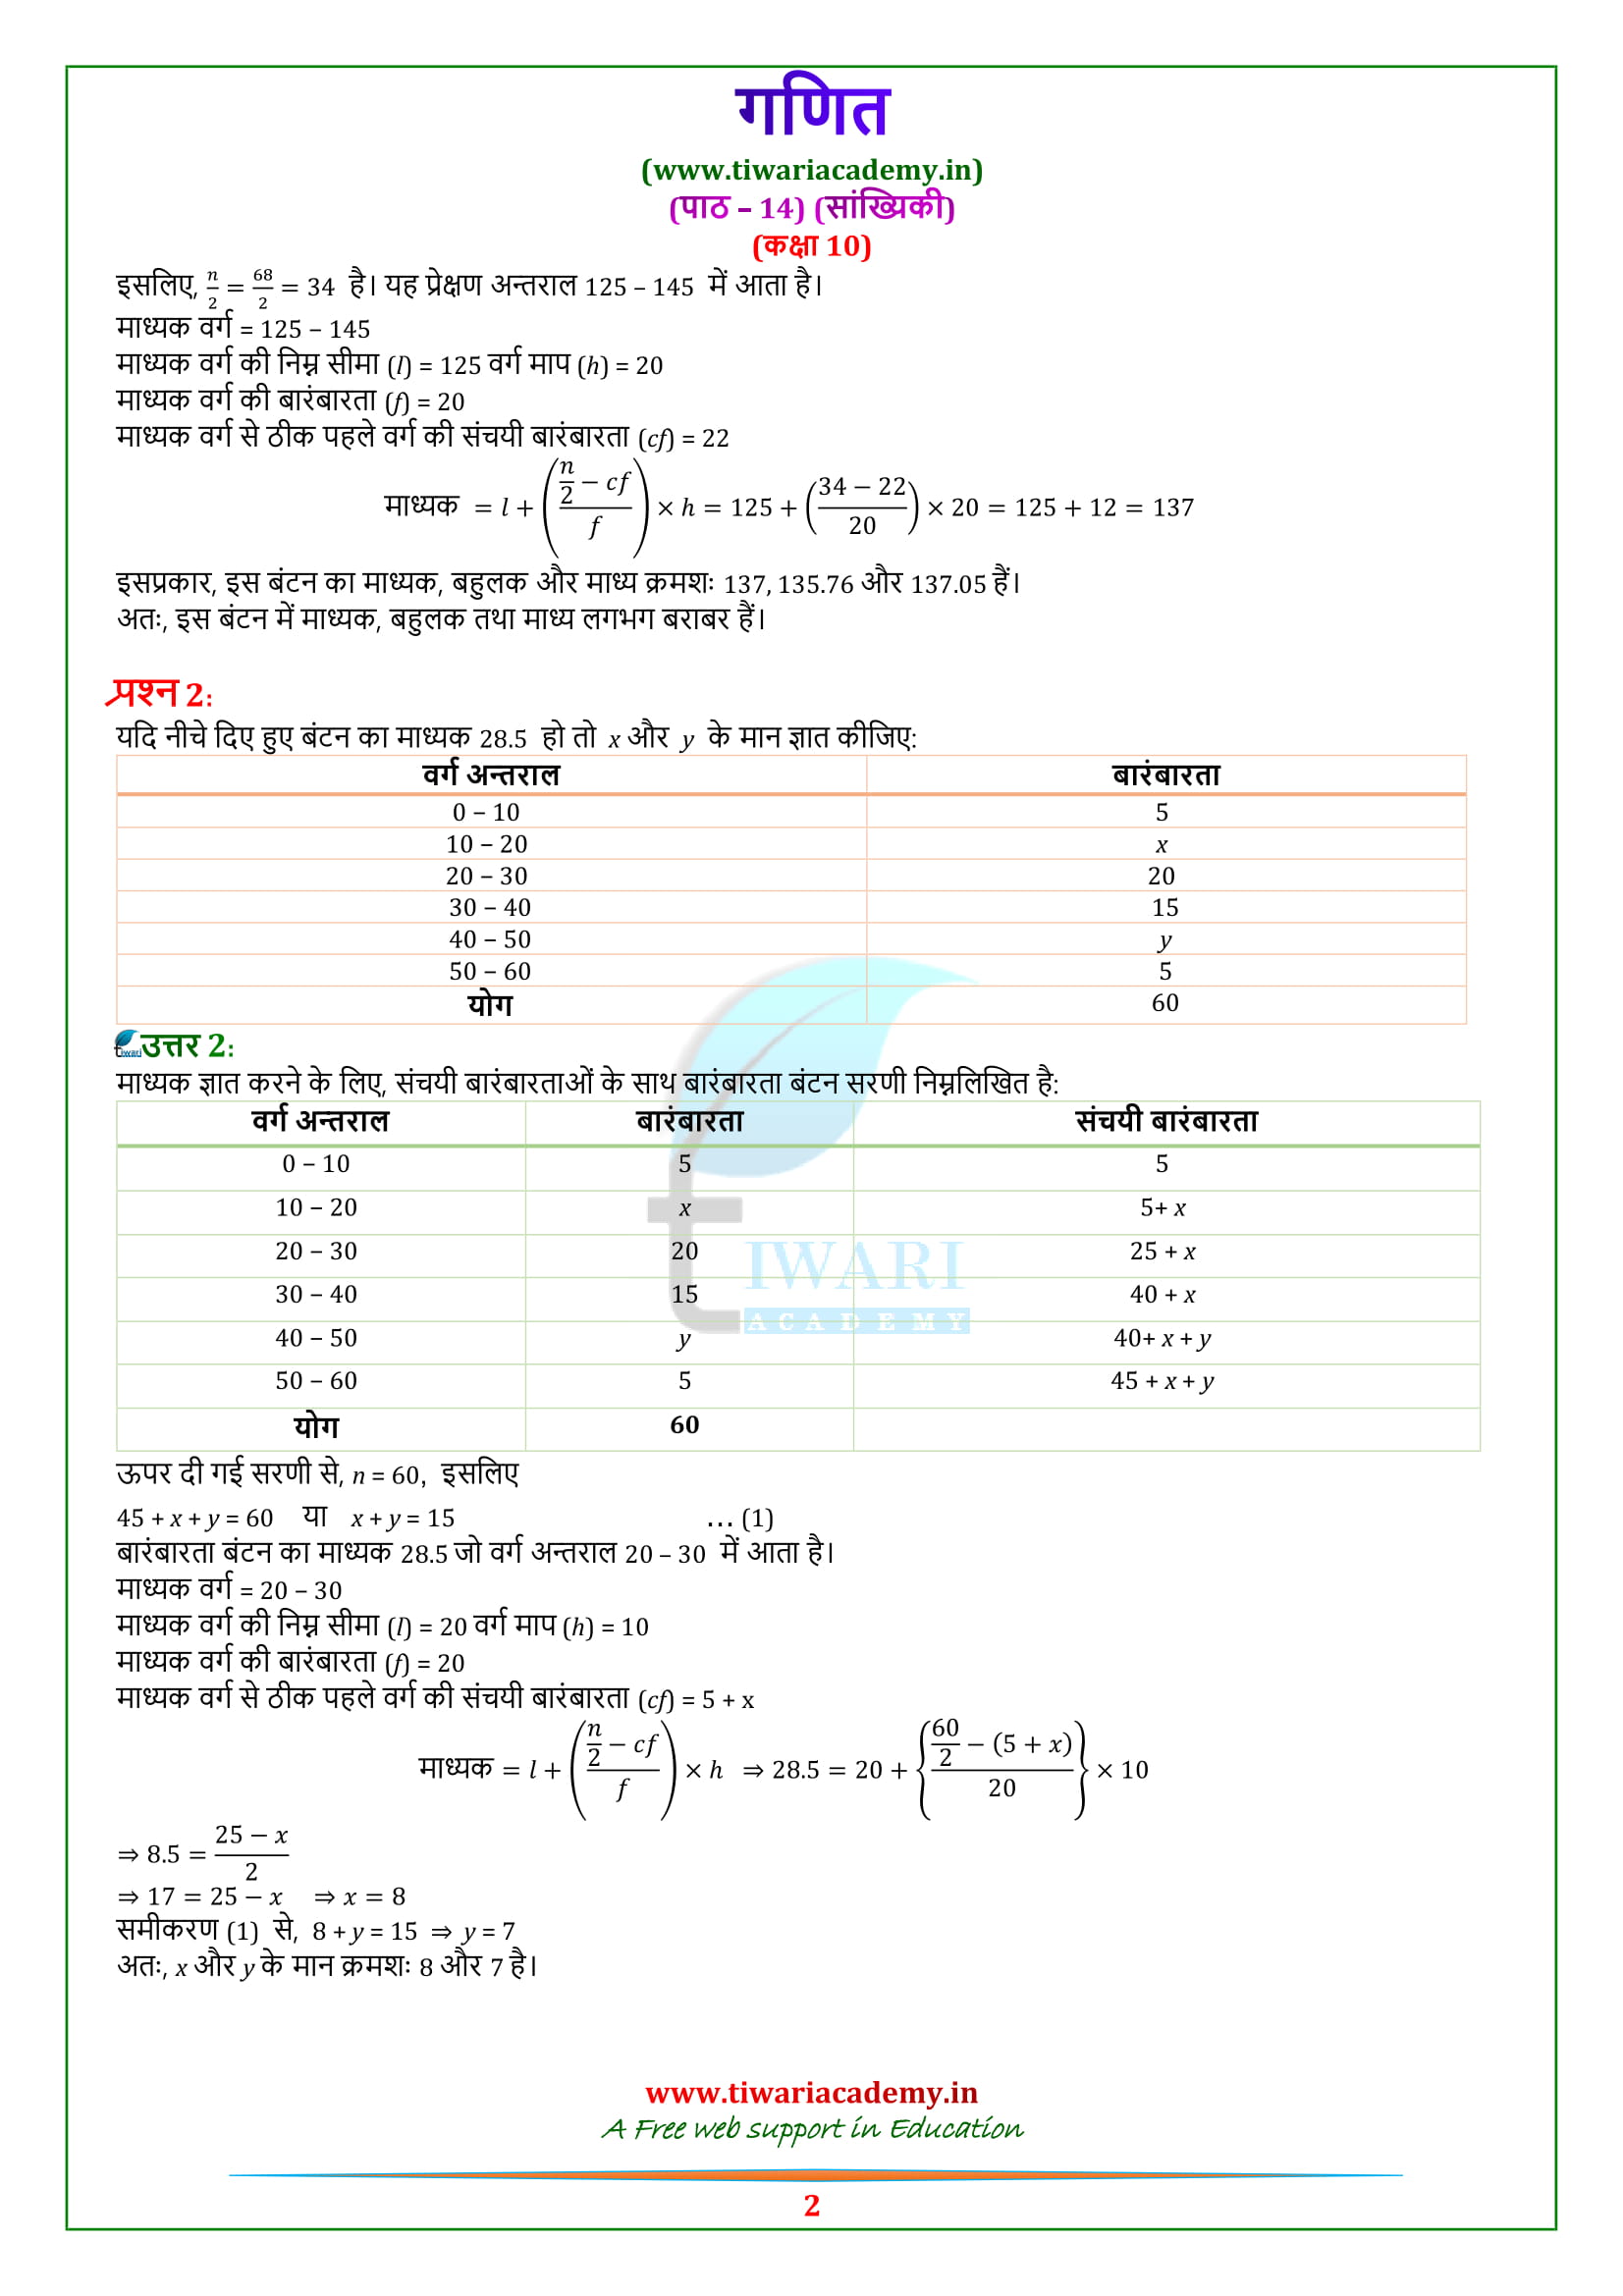
If you need solutions in Hindi, Click for Hindi Medium solutions of 10 Maths Exercise 14.3
Class 10 Maths Exercise 14.3 Solutions in Hindi Medium
To get the solutions in English, Click for English Medium solutions.
Important Questions on Statistics with answers
Selected from CBSE Sample Papers
- The median of the following distribution is 35, find the value of a and b.
- Class Interval 0-10 10-20 20-30 30-40 40-50 50-60 60-70 Total
- Frequency 10 20 a 40 b 25 15 170 [Answer: a= 35, b = 25]
- Find the mean, median and mode of the following data
- C.I. 45-55 55-65 65-75 75-85 85-95 95-105 105-115
- F 7 12 17 30 32 6 10 [Answer: Mean = 81.05, Median = 82, Mode = 85.71]
- Find the mean, median and mode of the following data
- Class Interval 11-15 16-20 21-25 26-30 31-35 36-40 41-45 46-50
- Frequency 2 3 6 7 14 12 4 2 [Answer: Mean = 32, Median = 33 and Mode = 34.38]
- The rainfall recorded in a city for 60 days is given in the following table:
- Rainfall (in cm) 0-10 10-20 20-30 30-40 40-50 50-60
- No. of Days 16 10 8 15 5 6
Calculate the median rainfall using a more than type ogive. Why is water conservation necessary? [Answer: Median = 25]
- Find the mean of the following distribution by step-deviation method.
- Daily Expenditure 100-150 150-200 200-250 250-300 300-350
- No. of Households 4 5 12 2 2 [Answer: Mean = 211]
- The distribution given below shows the marks of 100 students of a class
Marks No. of Students
0–5 4
5-10 6
10-15 10
15-20 10
20-25 25
25-30 22
30-35 18
35-40 5
Draw a less than type and a more than type ogive from the given data. Hence obtain the median marks from the graph. [Answer: Median = 24] - The annual profit earned by 30 factories in an industrial area is given below.
Draw both ogives for the data and hence find the median.
Profit (₹ in Lakh) No. of Factories
More than or equal to 5 30
More than or equal to 10 28
More than or equal to 15 16
More than or equal to 20 14
More than or equal to 25 10
More than or equal to 30 7
More than or equal to 35 3 [Answer: Median = 17.5]