
Free download NCERT Solutions for Class 10 Maths Chapter 14 Exercise 14.2 Statistics in English Medium and Hindi Medium PDF form to use it offline. NCERT Sols for class 10 all subjects have been uploaded in pdf file format for the convenience of students. The other Exercises of this chapter like Exercise 14.2 or Exercise 14.3 or Exercise 14.4 are here to use online without downloading. Both the options are provided to help the students. For any inconvenience you may call me any convenient time for assistance. We are working for your help only.
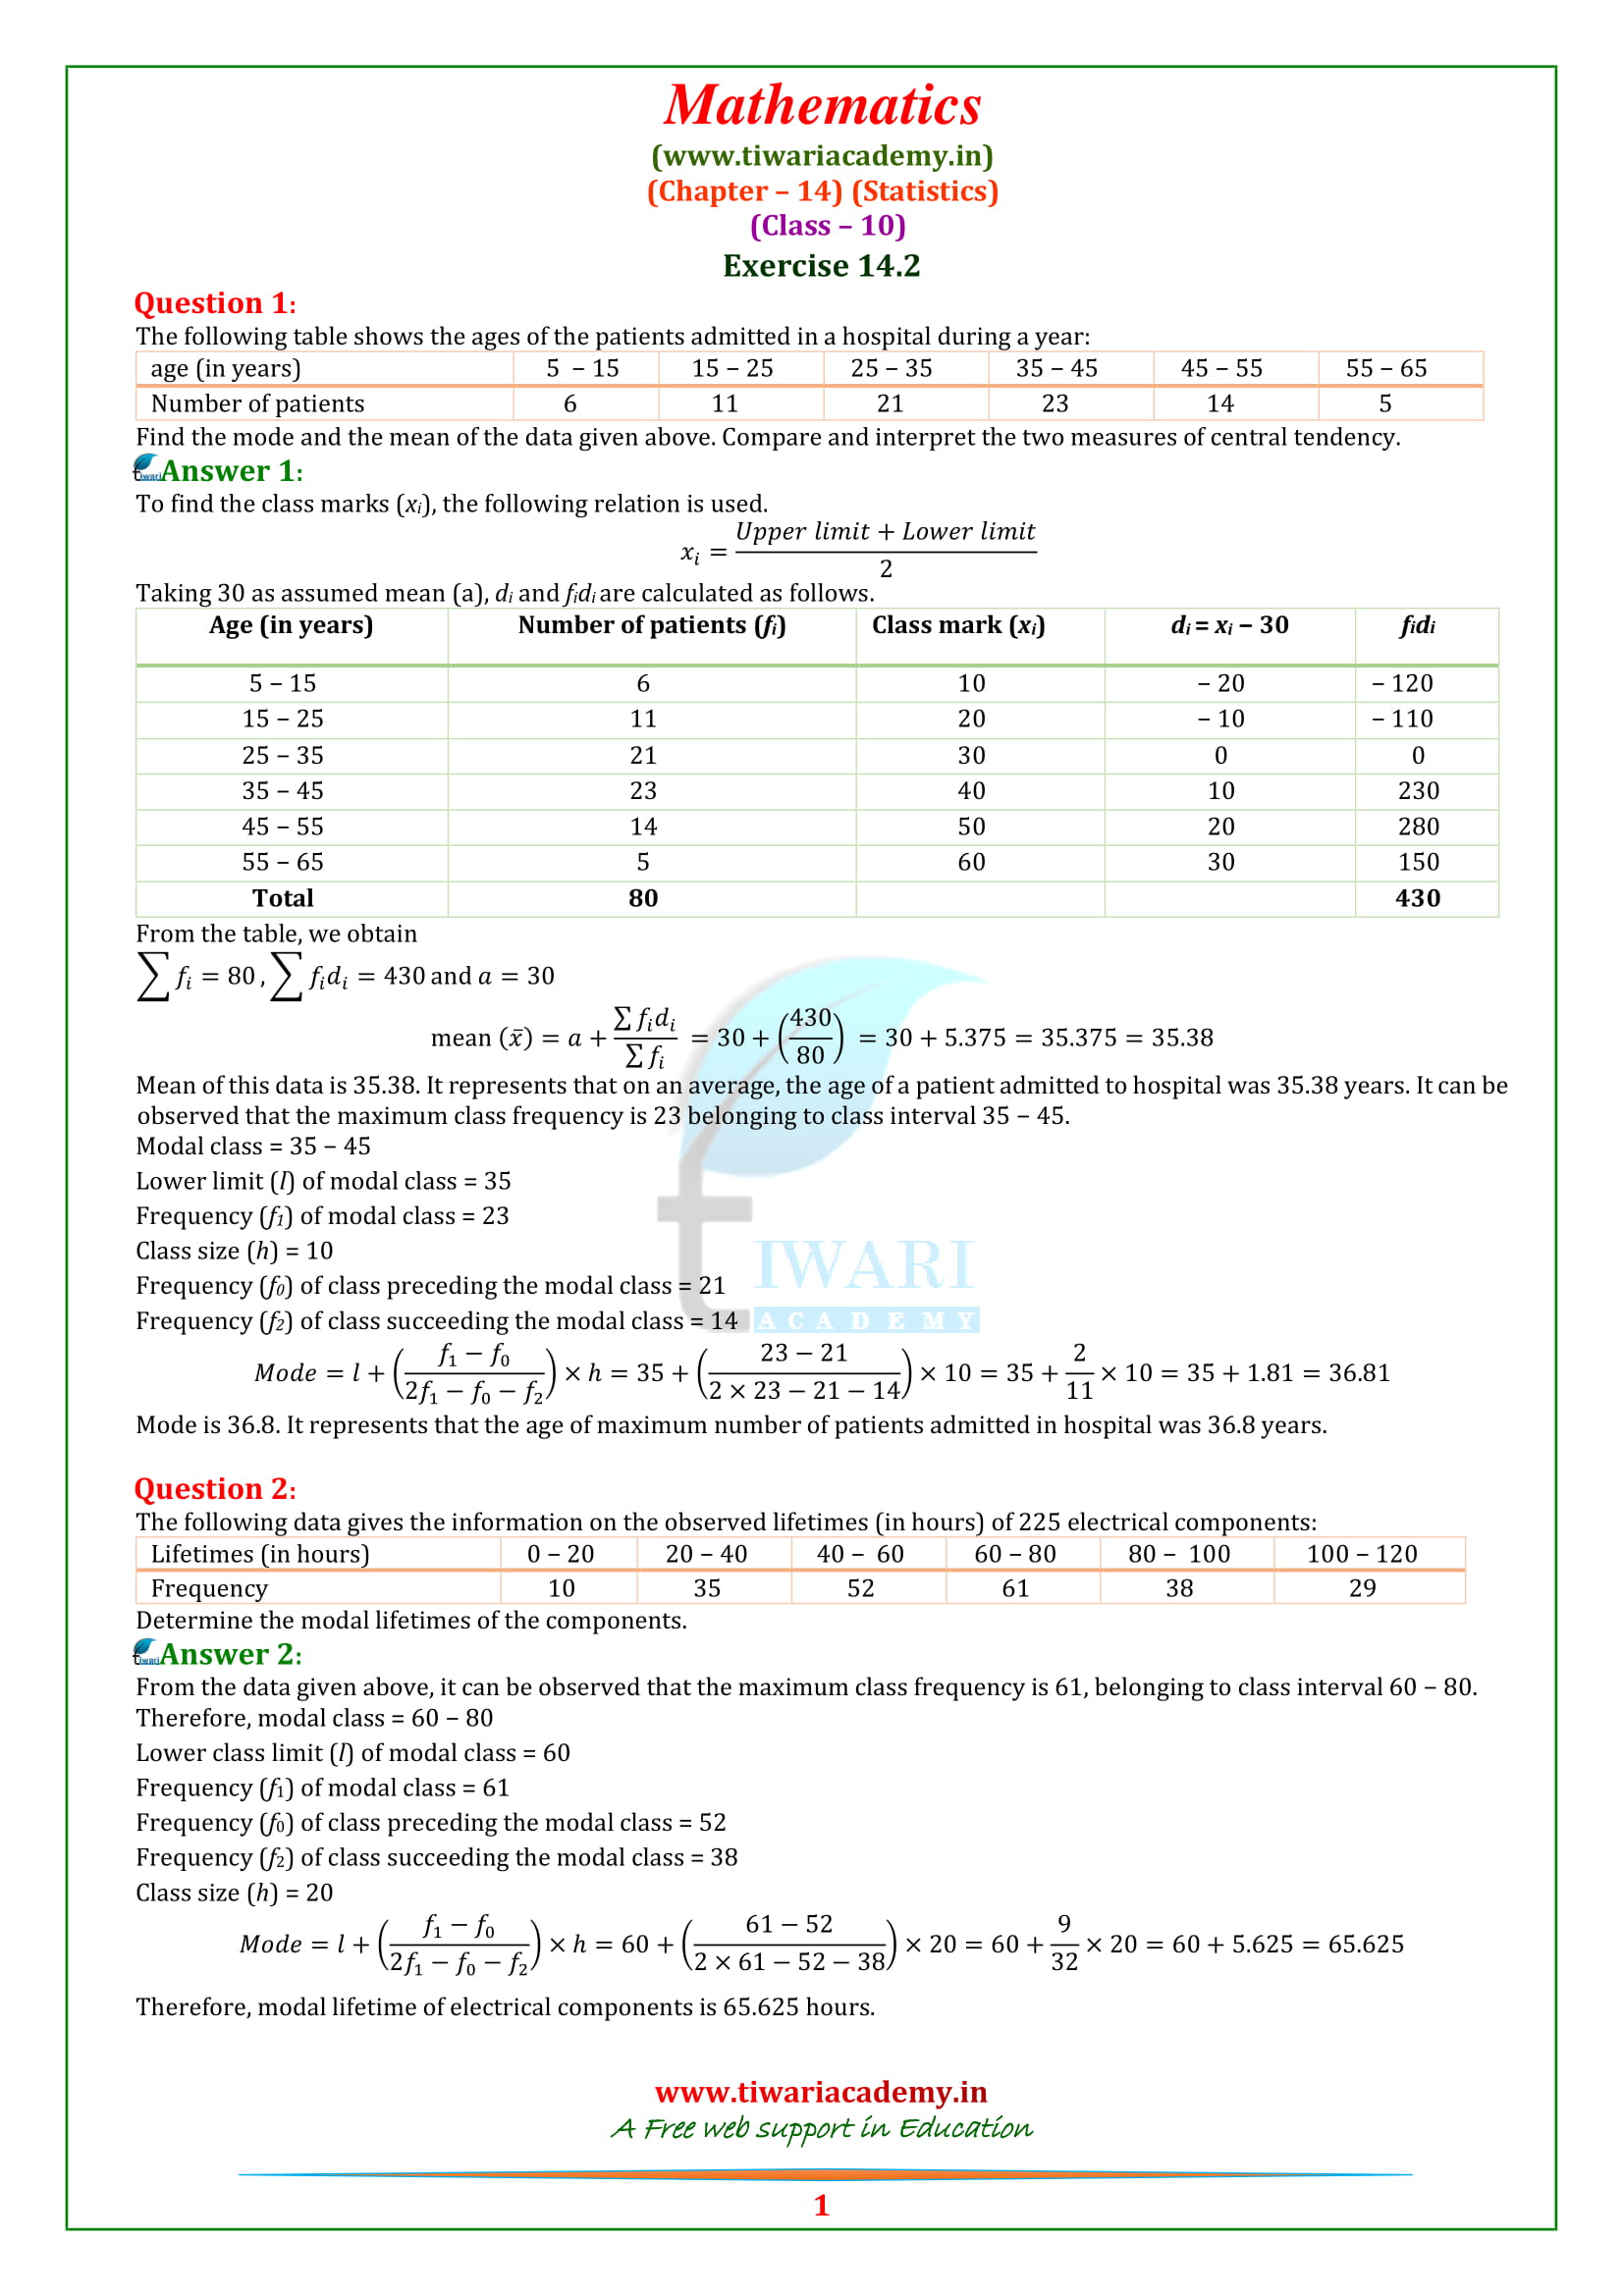
NCERT Solutions for Class 10 Maths Chapter 14 Exercise 14.2
If you need solutions in Hindi, Click for Hindi Medium solutions of 10 Maths Exercise 14.2
Class 10 Maths Exercise 14.2 Solutions in Hindi Medium
To get the solutions in English, Click for English Medium solutions.
Important Questions of Statistics With answers
Class X Maths – Questions selected from PREVIOUS YEARS PAPERS
- Write the following data into less than cumulative frequency distribution table.
- Marks 0-10 10-20 20-30 30-40 40-50
- No. of Students 7 9 6 8 10
- Find the mean of the following data
- Class Interval 0-10 10-20 20-30 30-40 40-50
- Frequency 8 12 10 11 9 [Answer: 25.2]
- If the mean of the following distribution is 54, find the value of P.
- Class 0-20 20-40 40-60 60-80 80-100
- Frequency 7 P 10 9 13 [Answer: 11]
- Find the median of the following frequency distribution.
- Class Interval 0-10 10-20 20-30 30-40 40-50 50-60
- Frequency 5 3 10 6 4 2 [Answer: 27]
- The median of following frequency distribution is 24. Find the missing frequency x.
- Age (in years) 0-10 10-20 20-30 30-40 40-50
- No. of Persons 5 25 x 18 7 [Answer: 25]
- Find the median of the following data.
- Marks Below 10 Below 20 Below 30 Below 40 Below 50 Below 60
- No. of students 0 12 20 28 33 40 [Answer: 20]
- Draw a ‘more than type’ ogive of the following data.
- Weight (in kg.) 30-35 35-40 40-45 45-50 50-55 55-60
- No. of Students 2 4 10 15 6 3
How is the overweight harmful for a person?
- Find the mode of the following data.
- Height (In cm) Above 30 Above 40 Above 50 Above 60 Above 70 Above 80
- No. of Plants 34 30 27 19 8 2 [Answer: 63.75]
- The mean of the following data is 53, find the value of f1 and f2.
- C.I. 0-20 20-40 40-60 60-80 80-100 Total
- F 15 f1 21 f2 17 100 [Answer: f1 = 18, f2 = 29]
- The mean of the following distribution is 57.6 and the sum of its frequencies is 50, find the missing frequencies f1 and f2.
- Class 0-20 20-40 40-60 60-80 80-100 100-120
- Frequency 7 f1 12 f2 8 5 [Answer: f1 = 8 and f2 = 10]
- If the median of the distribution given below is 28.5, find the values of x and y.
- Class Interval 0-10 10-20 20-30 30-40 40-50 50-60 Total
- Frequency 5 8 x 15 y 5 60 [Answer: x = 20, y = 7]