
Free download NCERT Solutions for Class 10 Maths Chapter 14 Exercise 14.4 statistics in English Medium and Hindi Medium PDF form. Solutions for class x other subjects download free. The other Exercises of this chapter like Exercise 14.1 or Exercise 14.2 or Exercise 14.3 are here to use it online.
NCERT Solutions for Class 10 Maths Chapter 14 Exercise 14.4
If you need solutions in Hindi, Click for Hindi Medium solutions of 10 Maths Exercise 14.4
Class 10 Maths Exercise 14.4 Solutions in Hindi Medium
To get the solutions in English, Click for English Medium solutions.
Class 10 Maths – Statistics
Cumulative frequency curve or an ogive
- (i) Ogive is the graphical representation of the cumulative frequency distribution.
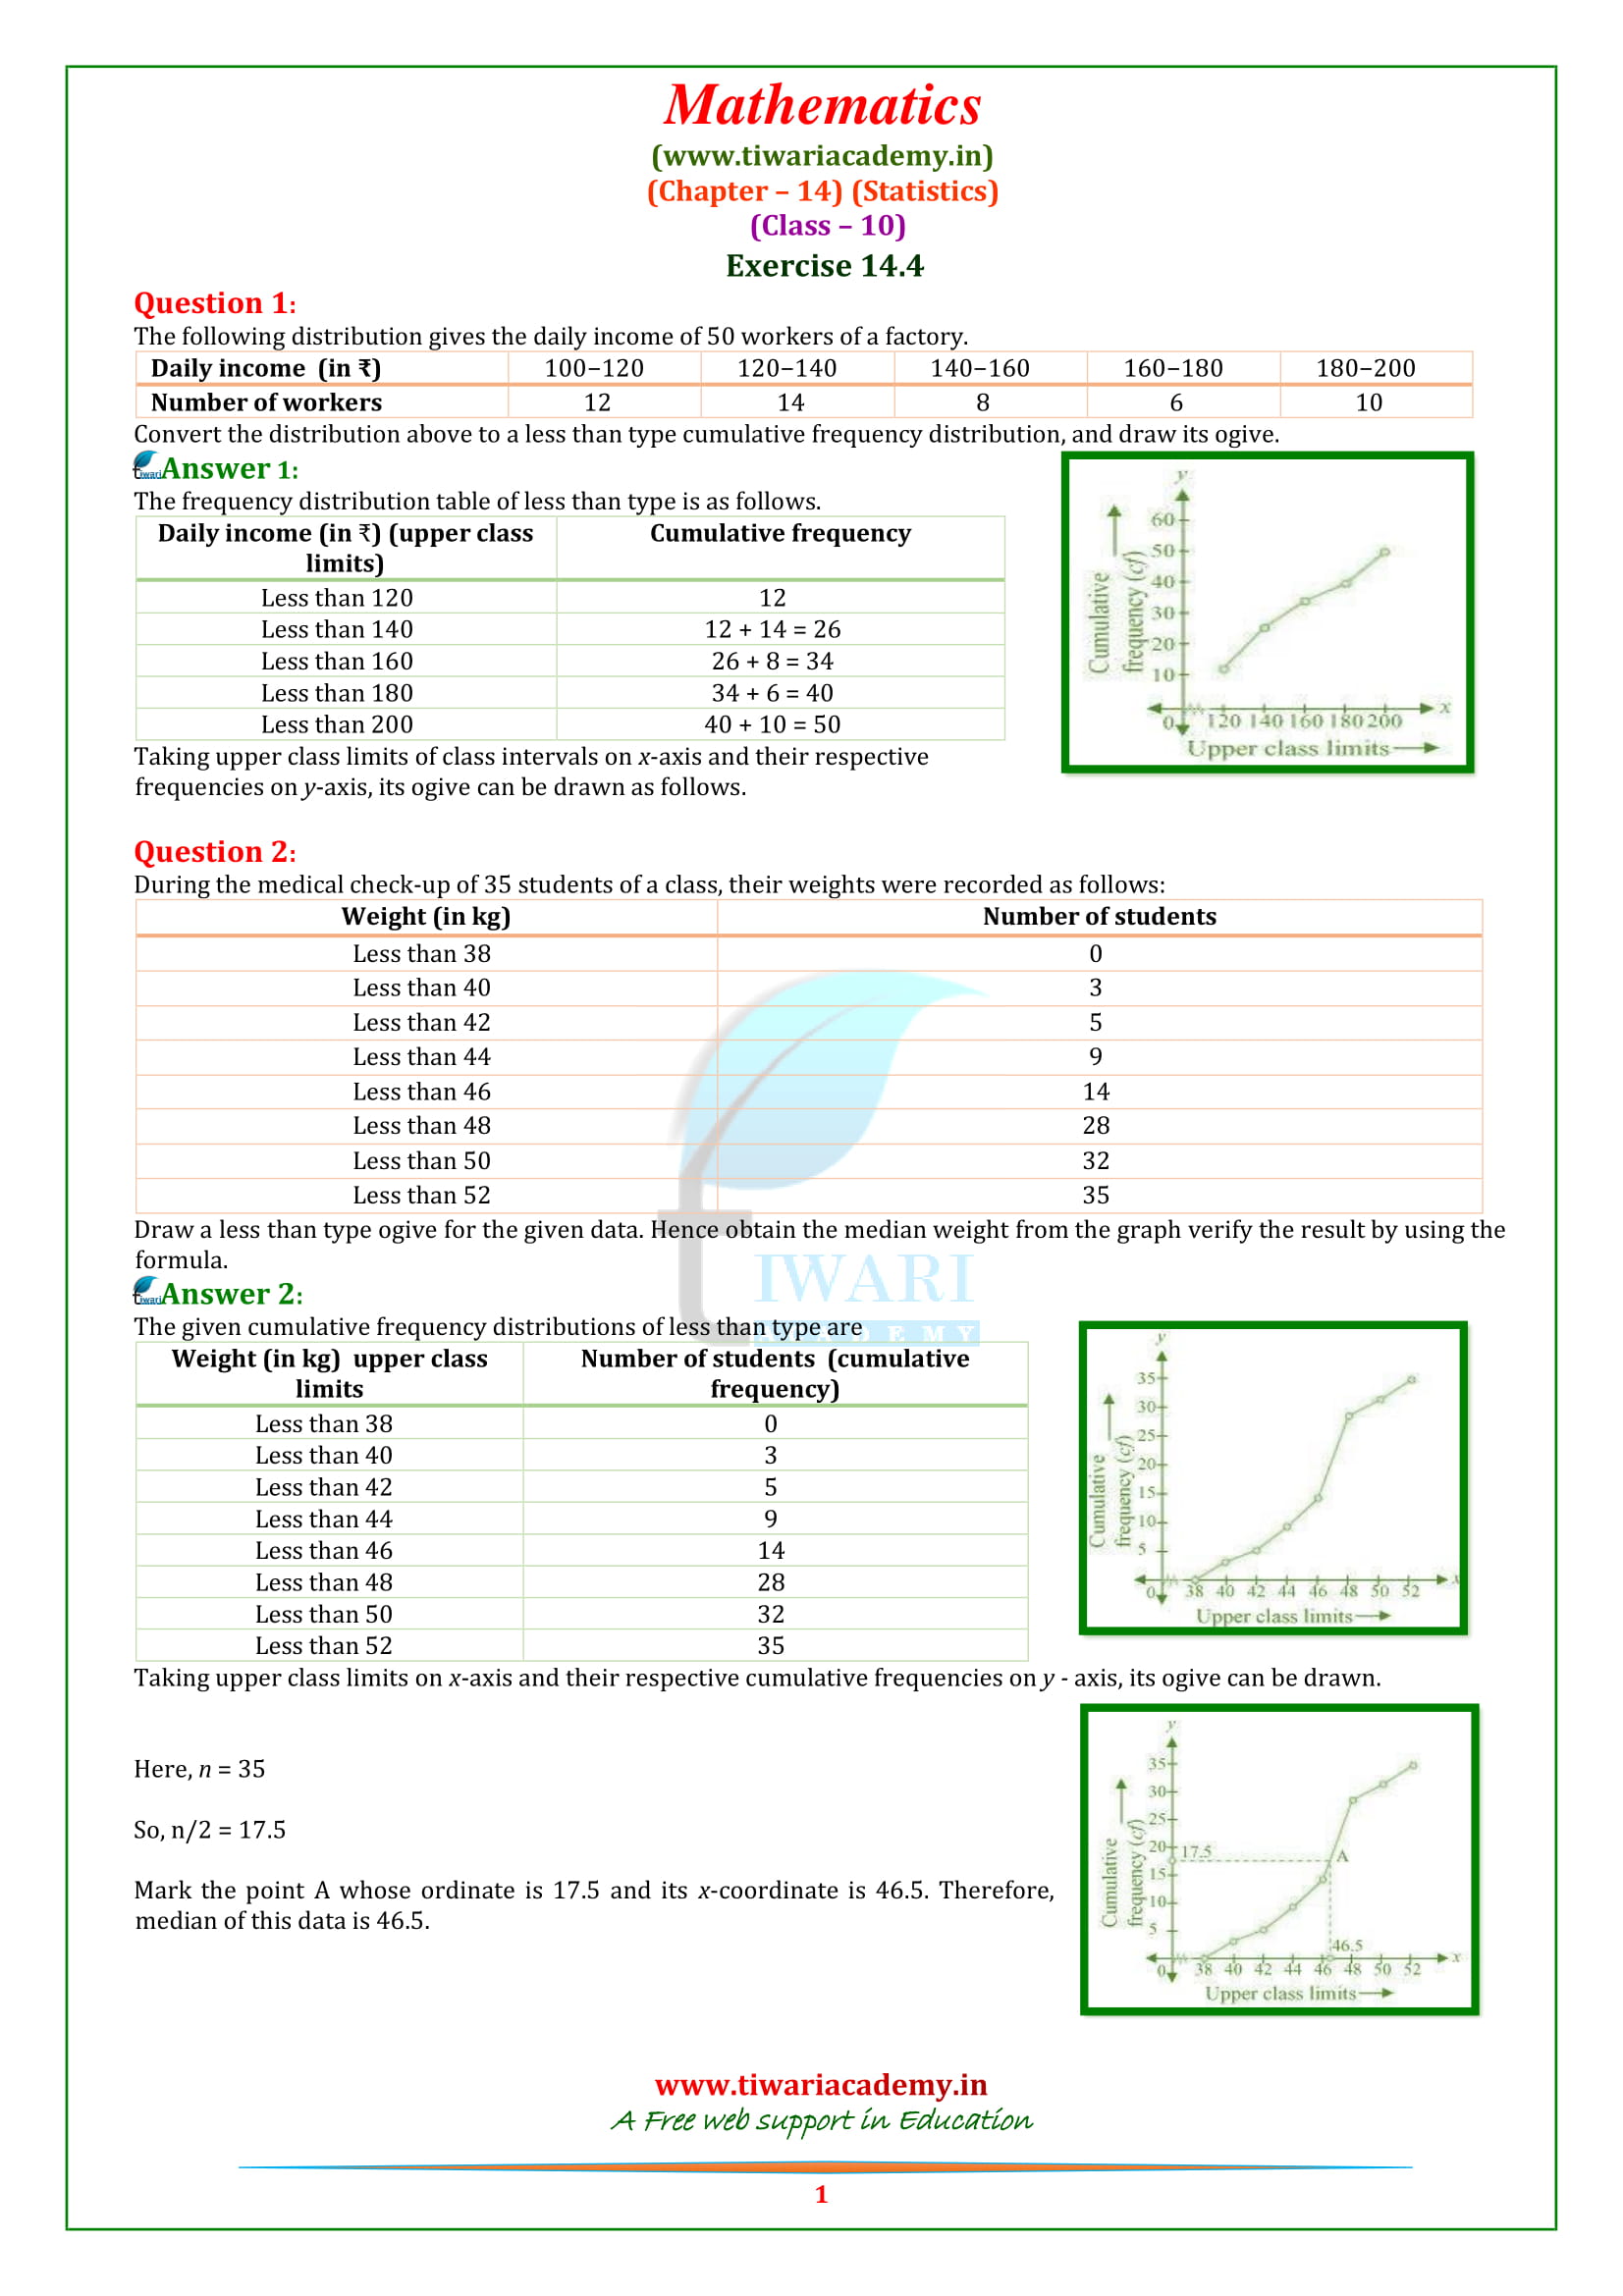
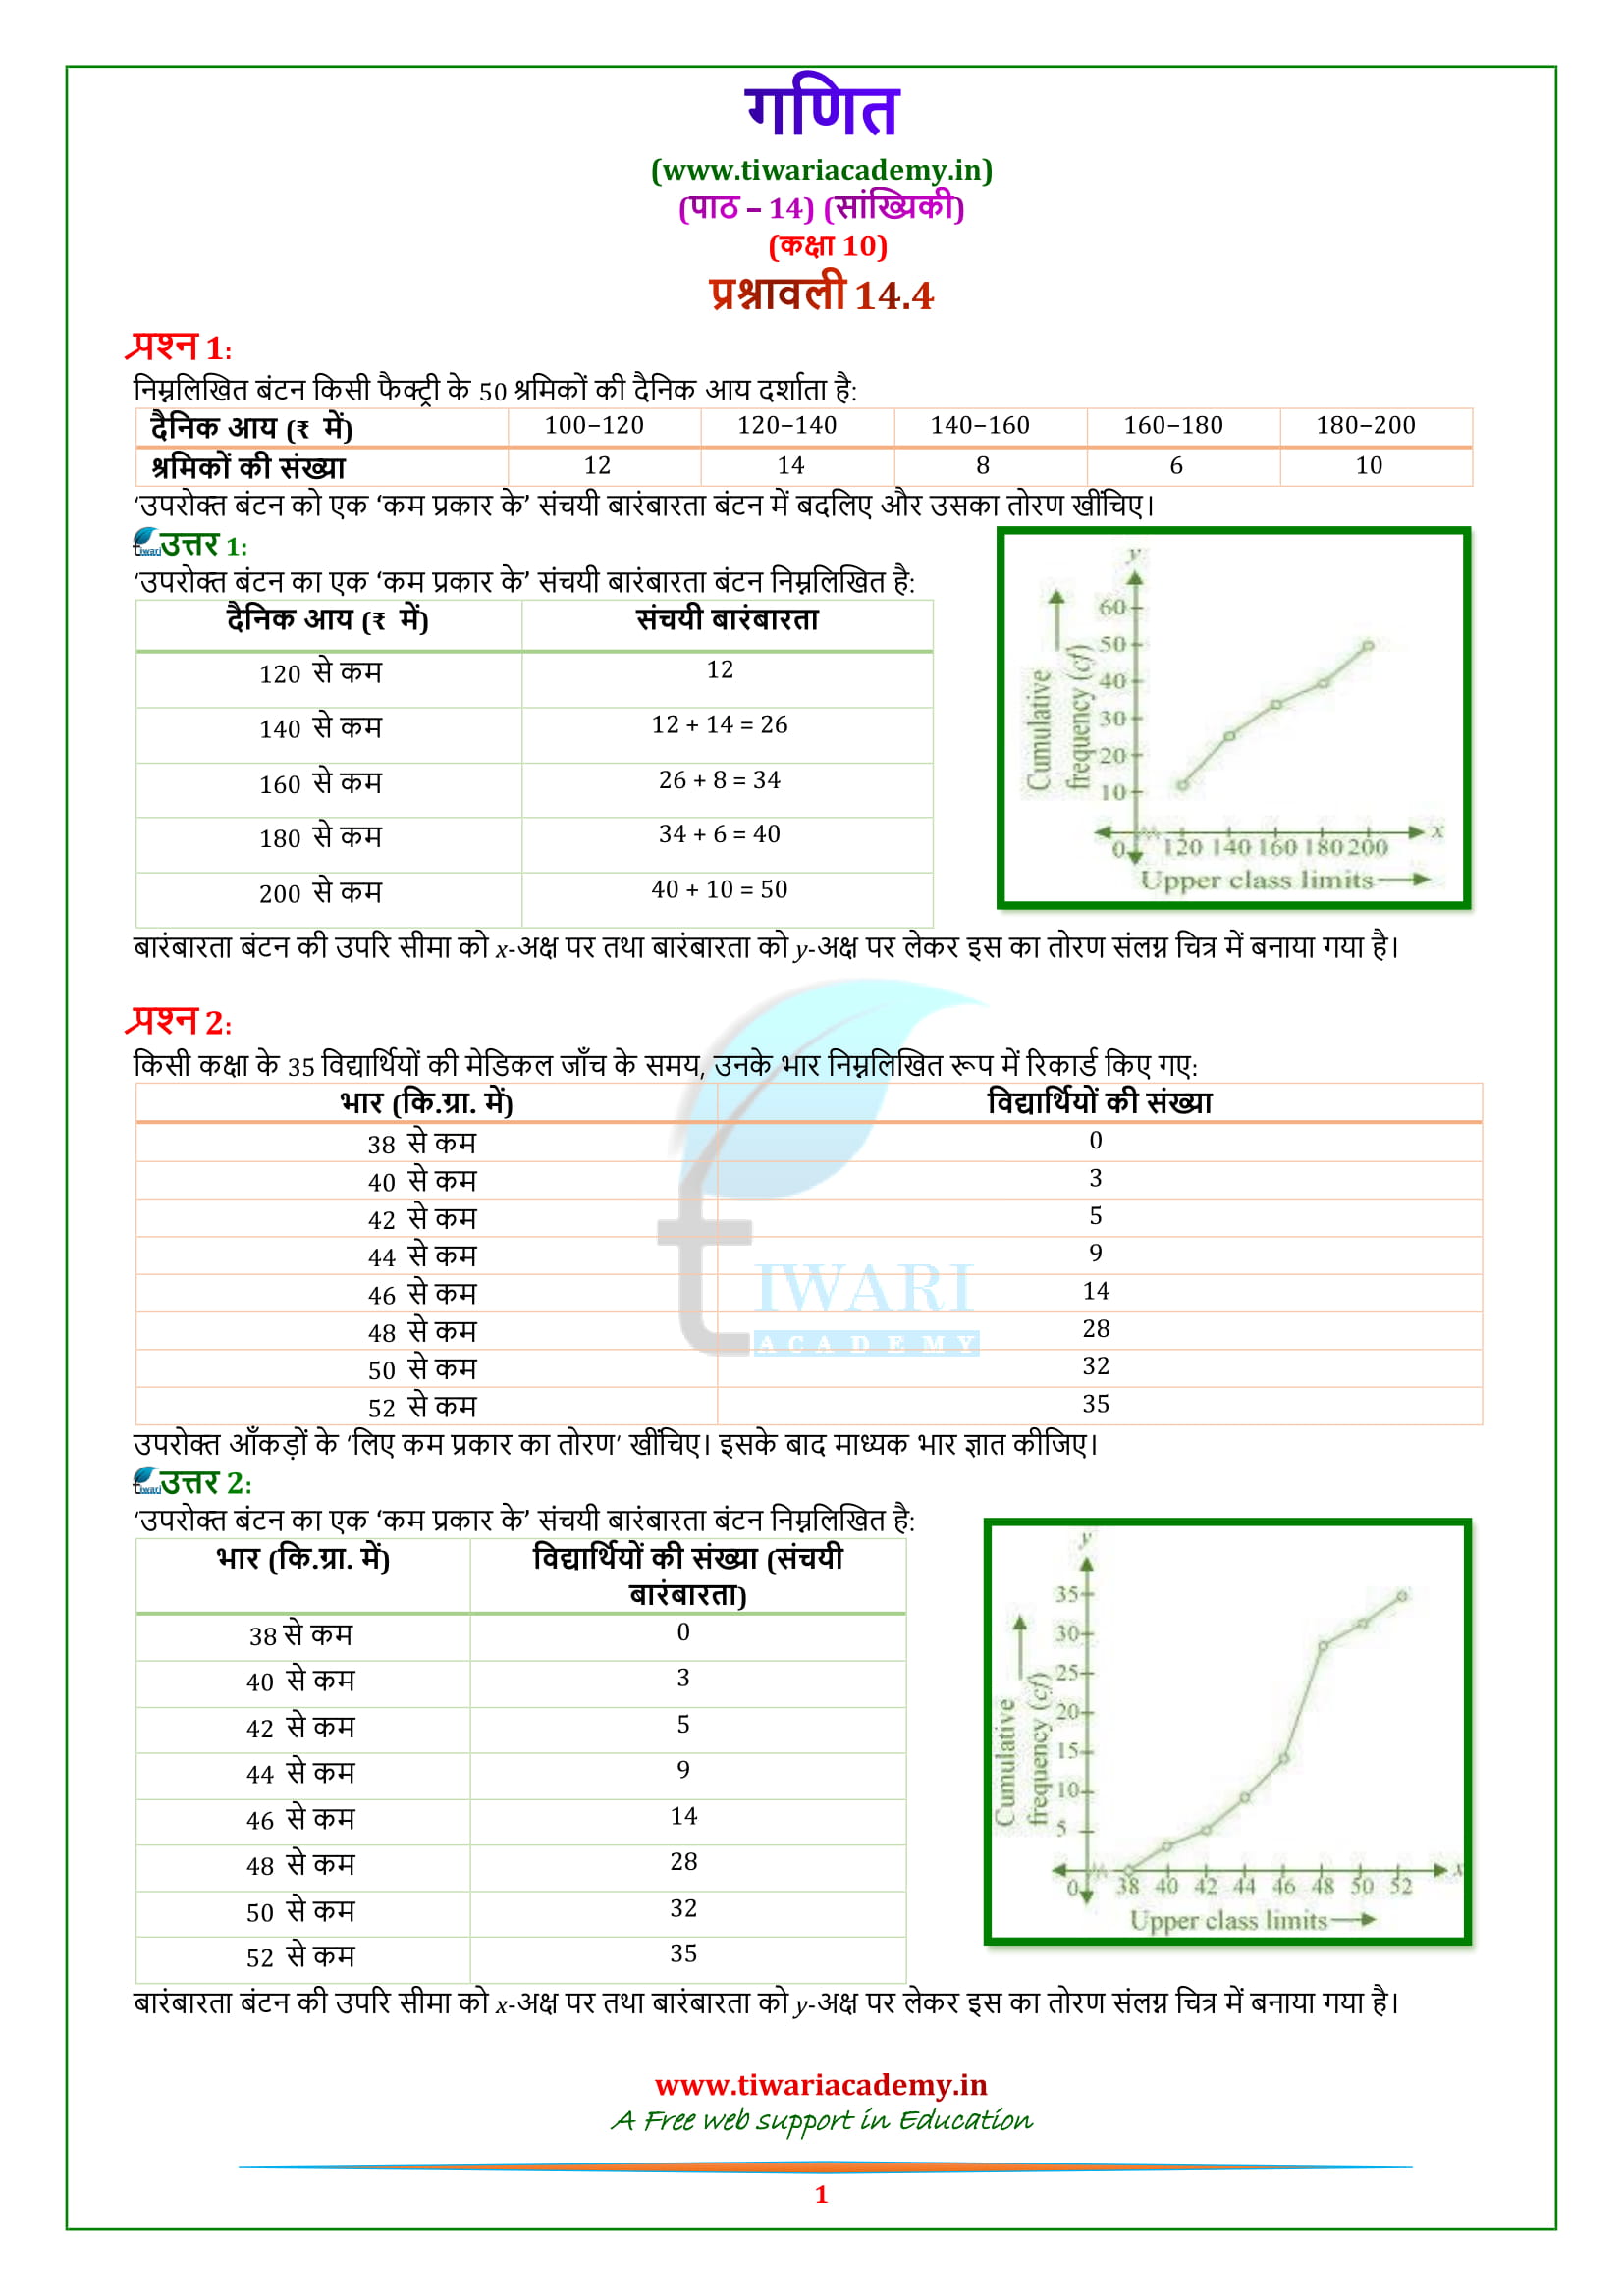
- (ii) Less than type Ogive:
- (a) Construct a cumulative frequency table.
- (b) Mark the upper class limit on the x-axis.
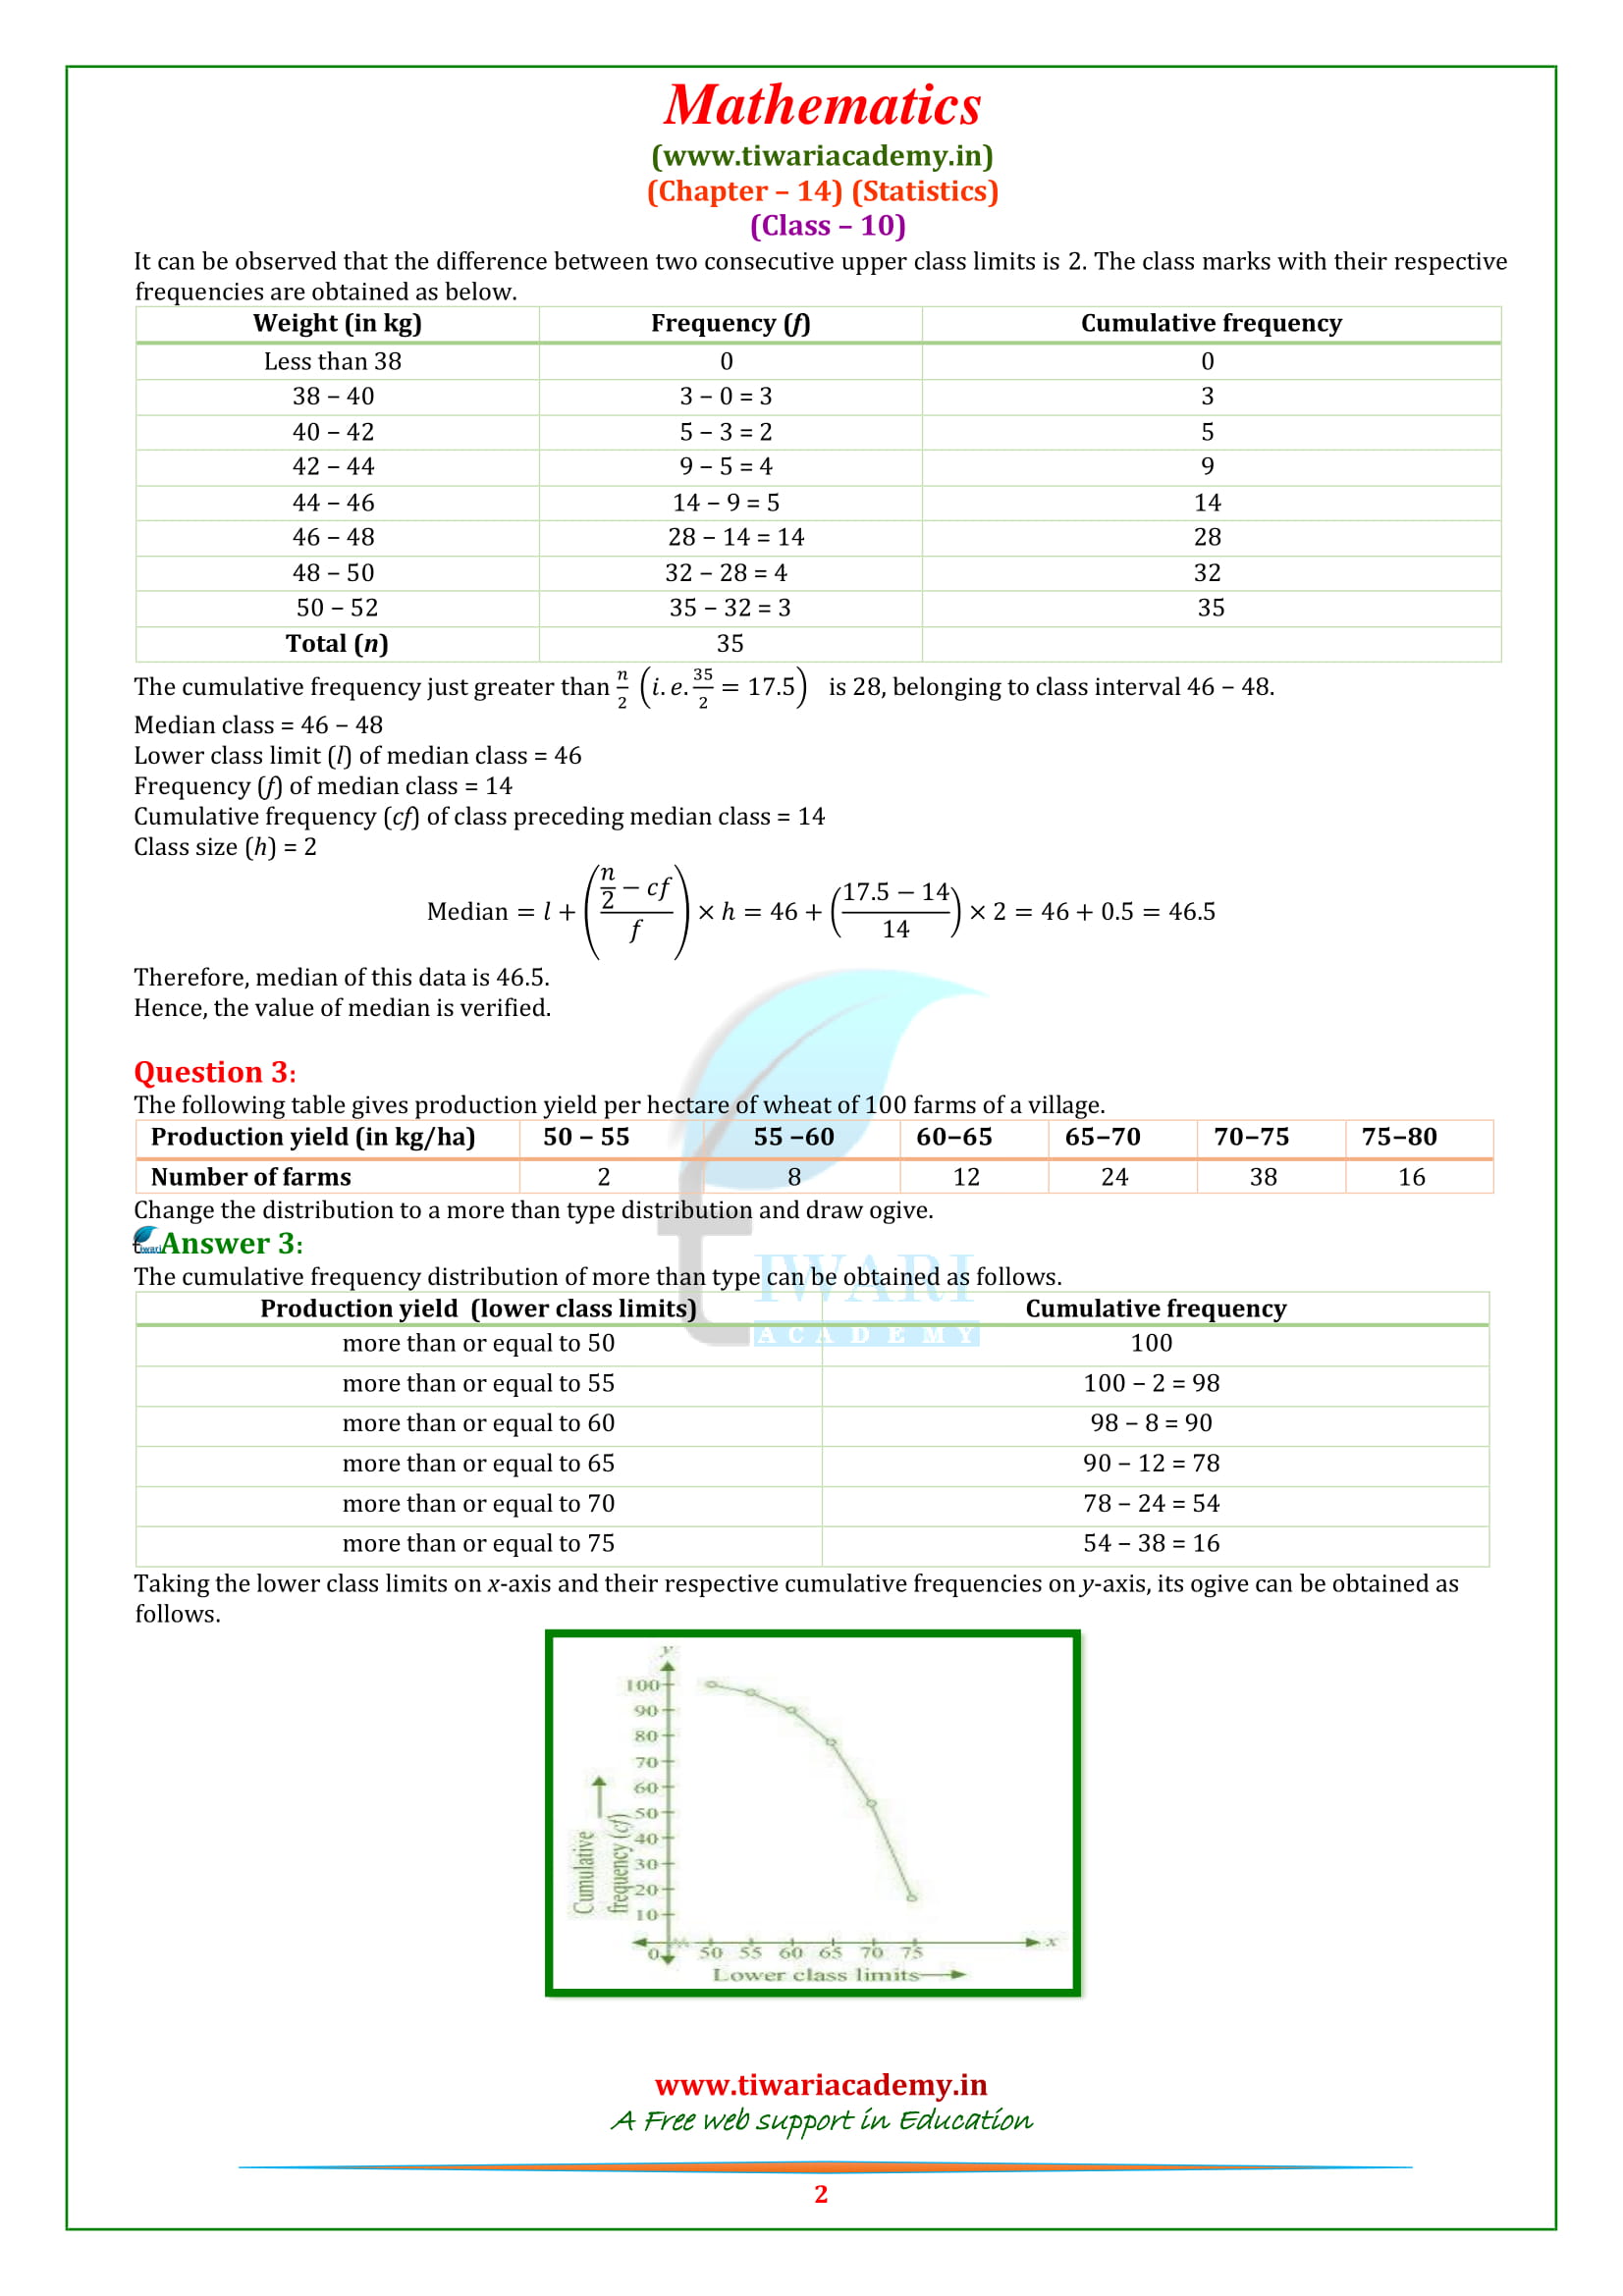
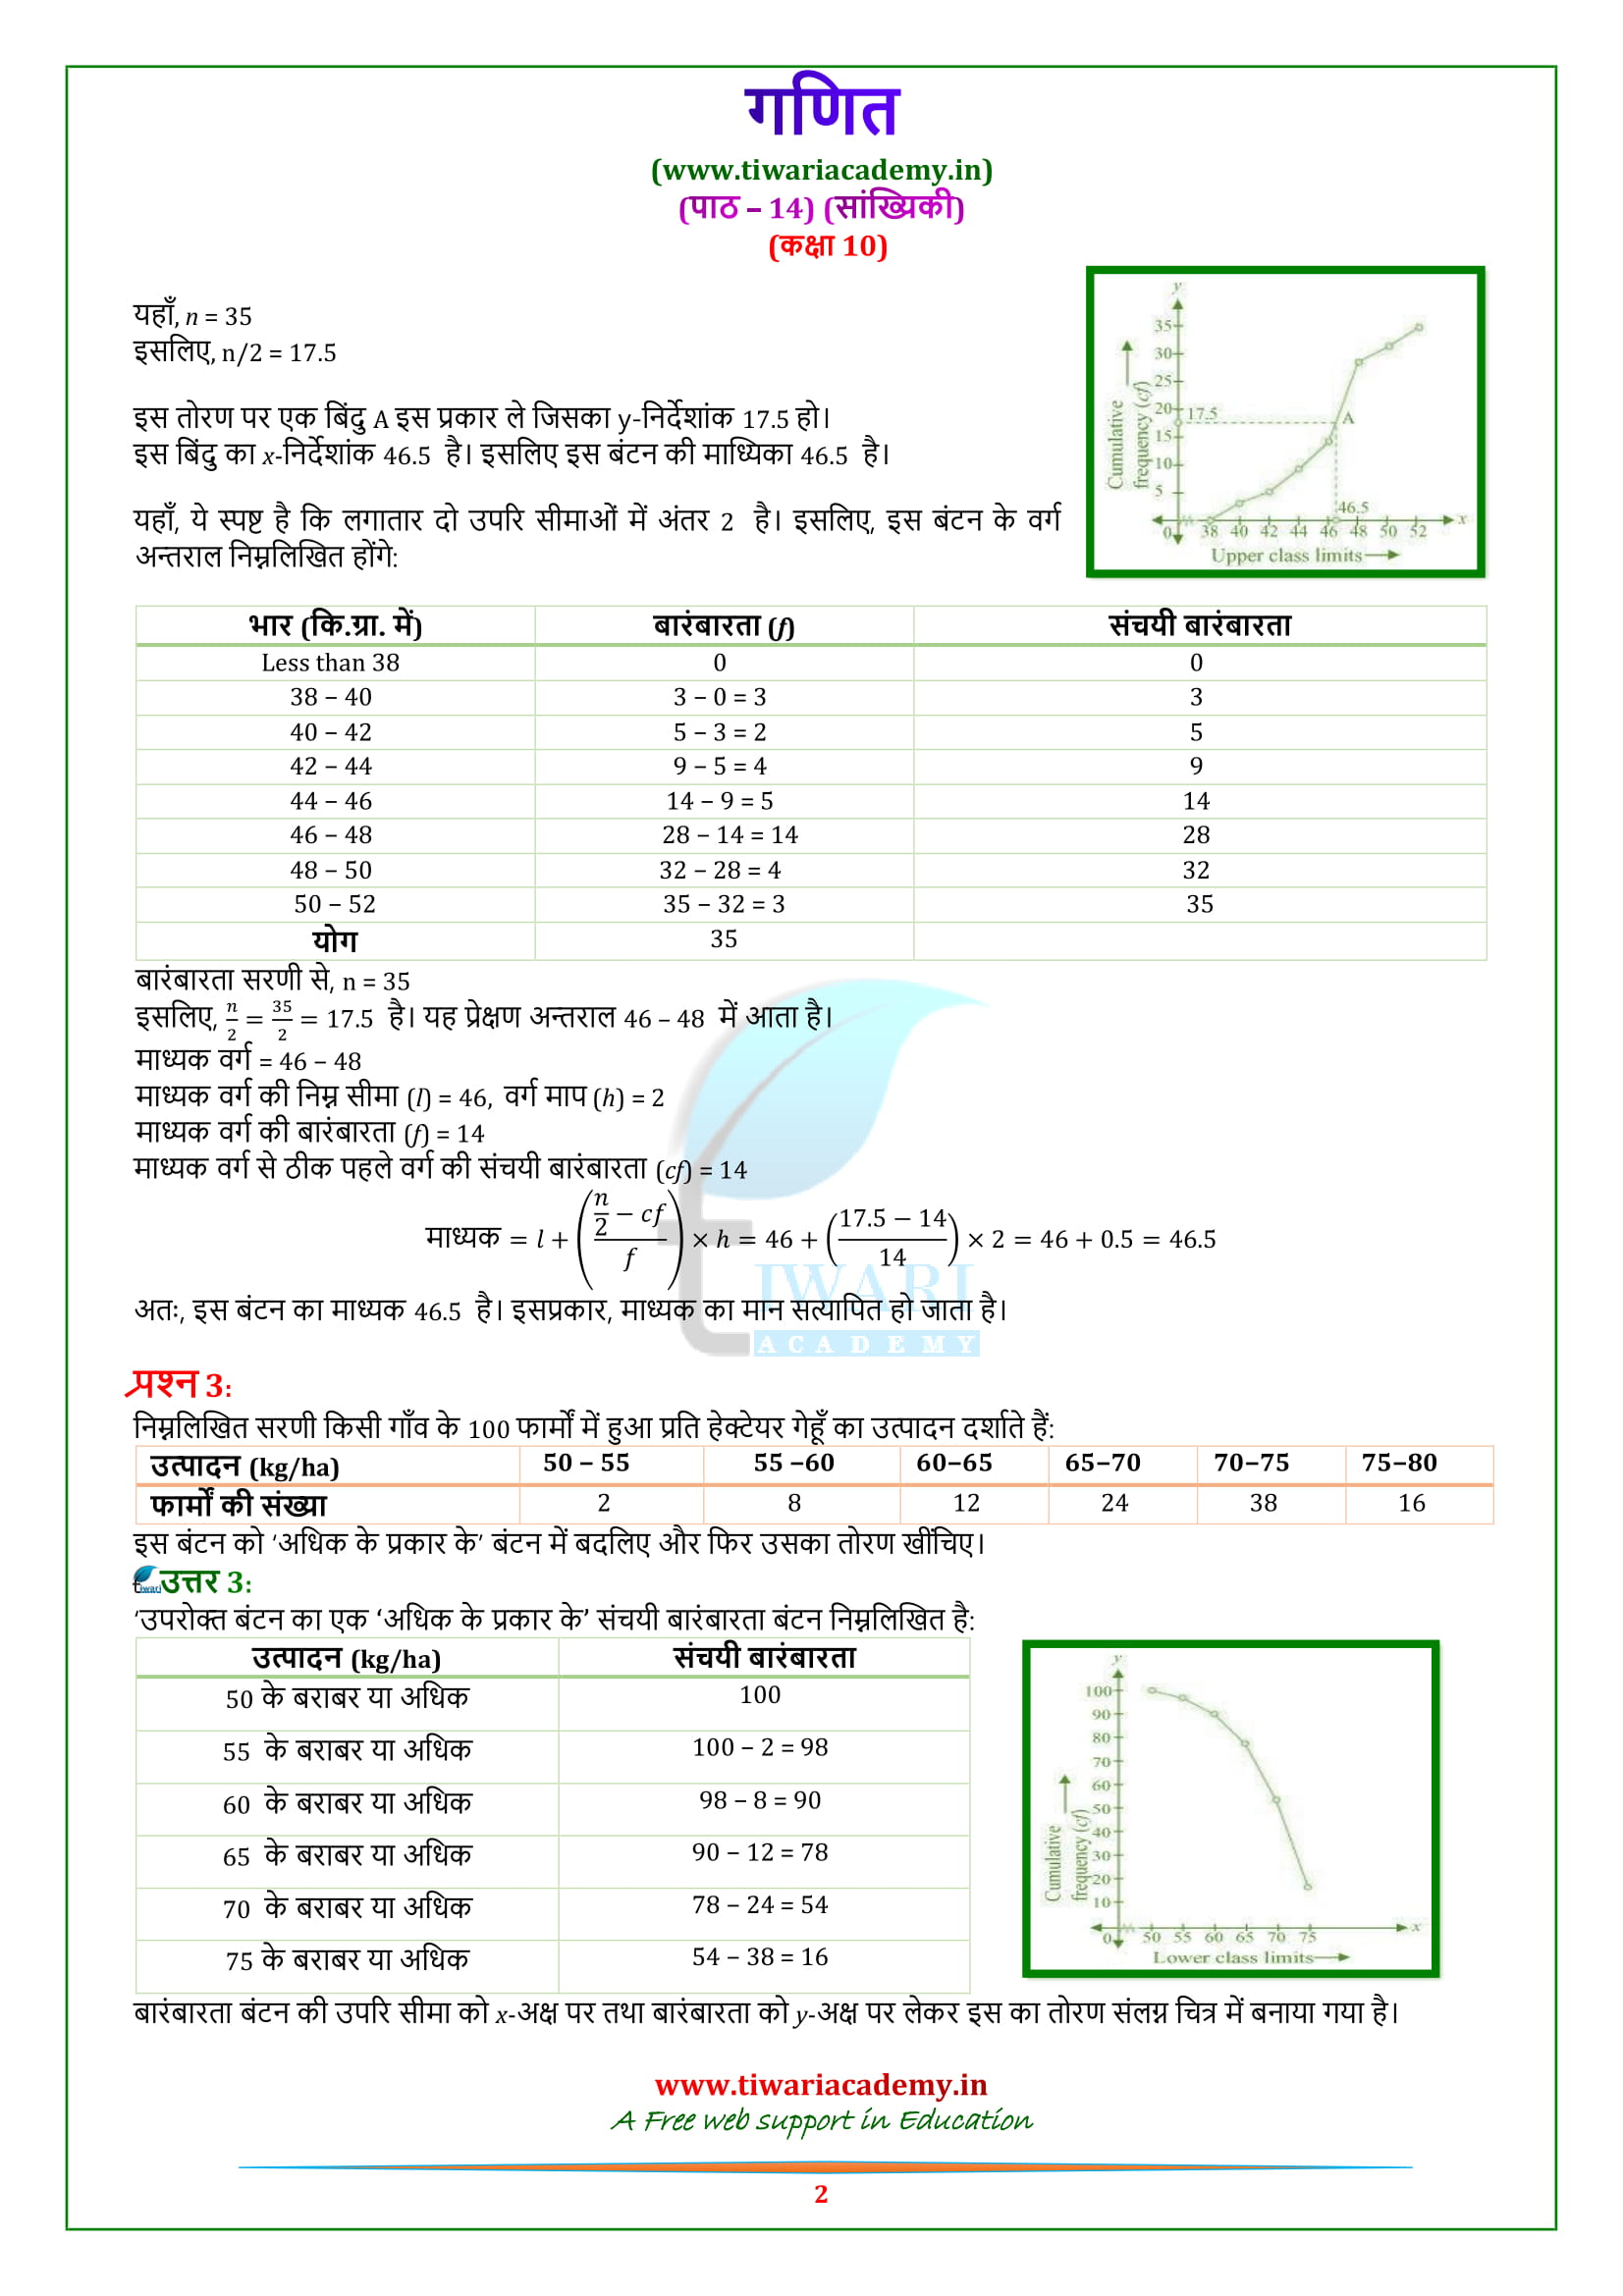
- (iii) More than type Ogive:
- (a) Construct a frequency table.
- (b) Mark the lower class limit on the x-axis.
- (iv) To obtain the median of frequency distribution from the graph:
Mode = 3 median – 2 mean
Practice Questions form Board Papers
- If the mode of the given data is 340. Find the missing frequency x for the following data.
- Class 0-100 100-200 200-300 300-400 400-500 500-600
- Frequency 8 12 x 20 14 7 [Answer: x = 16]
- What is the class mark of a class a – b. [Answer: (a+b)/2]
- Find the mean of all the even numbers between 11 and 21.
- The mean of 50 observations is 20. If each observation is multiplied by 3, then what will be the new mean?
- The mean of 10 observations is 15.3. If two observations 6 and 9 are replaced by 8 and 14 respectively. Find the new mean.
- Find the mode:
- Marks less than 20 less than 40 less than 60 less than 80 less than 100
- No. of Students 4 10 28 36 50
- Find the missing frequency, if the mode is given to be 58.
- Age (in Years). 20-30 30-40 40-50 50-60 60-70 70-80
- No. of Patients 5 13 x 20 18 19
- The mean of the following frequency distribution is 57.6 and the number of observations is 50. Find the missing frequencies f1 and f2.
- Class 0-20 20-40 40-60 60-80 80-100 100-120
- Frequency 7 f1 12 f2 8 5
- Following is the age distribution of cardiac patients admitted during a month in a hospital:
- Age (in Yrs.) 20-30 30-40 40-50 50-60 60-70 70-80
- No. of Patients 2 8 15 12 10 5
Draw a ‘less than type’ and ‘more than type’ ogives and from the curves, find the median.